- Home
- :
- All Communities
- :
- Developers
- :
- Python
- :
- Python Questions
- :
- Selection Cursor Question
- Subscribe to RSS Feed
- Mark Topic as New
- Mark Topic as Read
- Float this Topic for Current User
- Bookmark
- Subscribe
- Mute
- Printer Friendly Page
- Mark as New
- Bookmark
- Subscribe
- Mute
- Subscribe to RSS Feed
- Permalink
Hello everyone,
I have a feature class which looks like this:
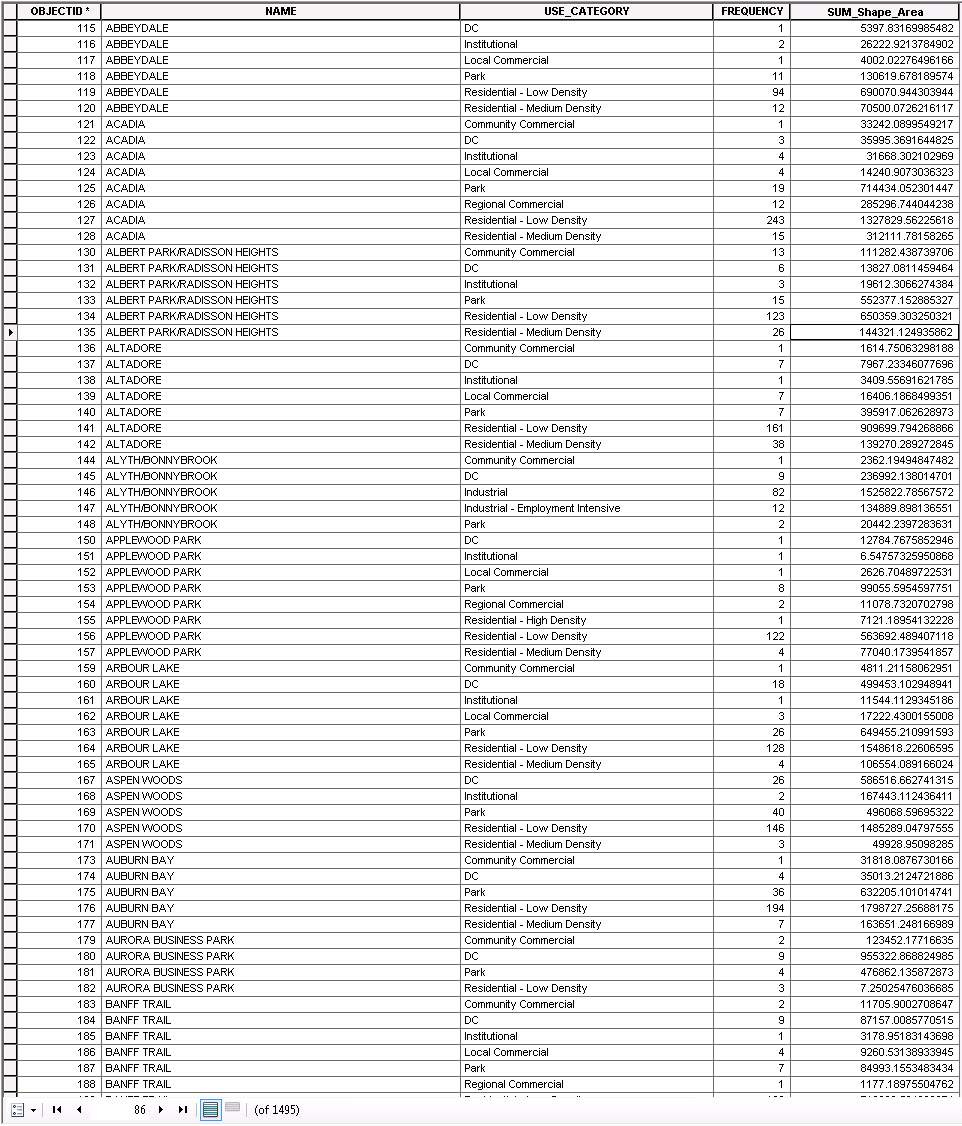
What I need to do is loop through each group of records in the NAME field where the value is the same (these are community names) and perform a calculation which is based on the Area values for each USE_CATEGORY and the Sum of all USE_CATEGORY Area values (which will give us the total area for the community). I think the following excel snapshot outlines the calculation to be done against each community (NAME):
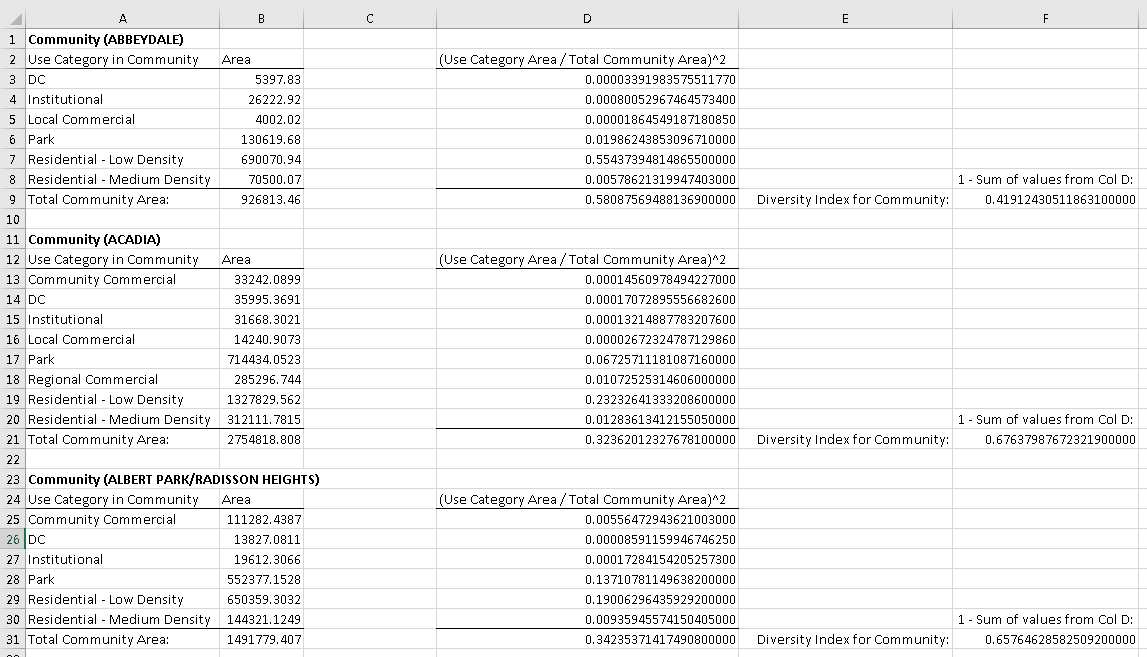
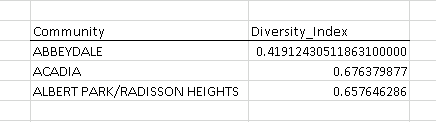
The end goal is to create a new table that will show the community along with the calculated diversity index for that community:
I'm thinking some sort of loop would be used to select the records for each community, but I'm not sure of the best way to go about that and also how do you move on to select the records for the next community. Looking for some guidance and ideas on how to best get this done.
Thanks everyone,
Chris
Solved! Go to Solution.
Accepted Solutions
- Mark as New
- Bookmark
- Subscribe
- Mute
- Subscribe to RSS Feed
- Permalink
You will need to get a list of the unique community names, from there you could batch a select by attributes within a loop, do the calculation update store the result then move on. Perhaps people that work with cursors more often will leap in, I would do this all in numpy (some use Pandas) and save out to a summary table there. numpy and pandas are better at vectorizing queries and calculations than most cursor operations.
- Mark as New
- Bookmark
- Subscribe
- Mute
- Subscribe to RSS Feed
- Permalink
Summary Statistics will provide you with some of the data...
From that table, you can do your calculations using the area data
- Mark as New
- Bookmark
- Subscribe
- Mute
- Subscribe to RSS Feed
- Permalink
I actually used Summary Statistics to create the table that has the 1495 records in it. The original table had around 35000 records. I used the Summary Statistics to group by NAME and USE_CATEGORY and SUM Area.
Where I'm stumped with now is how to write the code to pull the records for each community, complete the calculation then move onto the next community in the list. Thanks!
- Mark as New
- Bookmark
- Subscribe
- Mute
- Subscribe to RSS Feed
- Permalink
You will need to get a list of the unique community names, from there you could batch a select by attributes within a loop, do the calculation update store the result then move on. Perhaps people that work with cursors more often will leap in, I would do this all in numpy (some use Pandas) and save out to a summary table there. numpy and pandas are better at vectorizing queries and calculations than most cursor operations.
- Mark as New
- Bookmark
- Subscribe
- Mute
- Subscribe to RSS Feed
- Permalink
I got a script working so thought I'd share it. Seems to get the job done. Down the road when I have a better understanding of pandas I think I'll give that a try as it does seem the dataframe is the way to go.
import arcpy
import numpy as np
updateFc = 'X:/gis/ludiversity/ludiversity.gdb/CommunityStats'
updateFields = ['NAME','SUM_Shape_Area','DIVERSITY_INDEX']
searchFc = 'X:/gis/ludiversity/ludiversity.gdb/Community_UseCategoryStats'
searchFields = ['NAME','USE_CATEGORY','SUM_Shape_Area']
with arcpy.da.UpdateCursor(updateFc,updateFields) as uCur:
#loop through each community record in updateFc
for uRow in uCur:
whereClause = "NAME = '" + uRow[0] + "'"
with arcpy.da.SearchCursor(searchFc,searchFields,whereClause) as selCur:
interimValue = [0] #list to store calculation for each USE_CATEGORY value
for sRow in selCur:
#divide the USE_CATEGORY area by the total community area then square that number & append it to the list
interimValue.append(np.square(sRow[2]/uRow[1]))
#sum the values in the list then subtract that value from 1 to get the diversity index for the community
uRow[2]= 1 - sum(interimValue)
uCur.updateRow(uRow)