- Home
- :
- All Communities
- :
- Developers
- :
- Python
- :
- Python Questions
- :
- Python solution to convert single column into mult...
- Subscribe to RSS Feed
- Mark Topic as New
- Mark Topic as Read
- Float this Topic for Current User
- Bookmark
- Subscribe
- Mute
- Printer Friendly Page
Python solution to convert single column into multiple columns
- Mark as New
- Bookmark
- Subscribe
- Mute
- Subscribe to RSS Feed
- Permalink
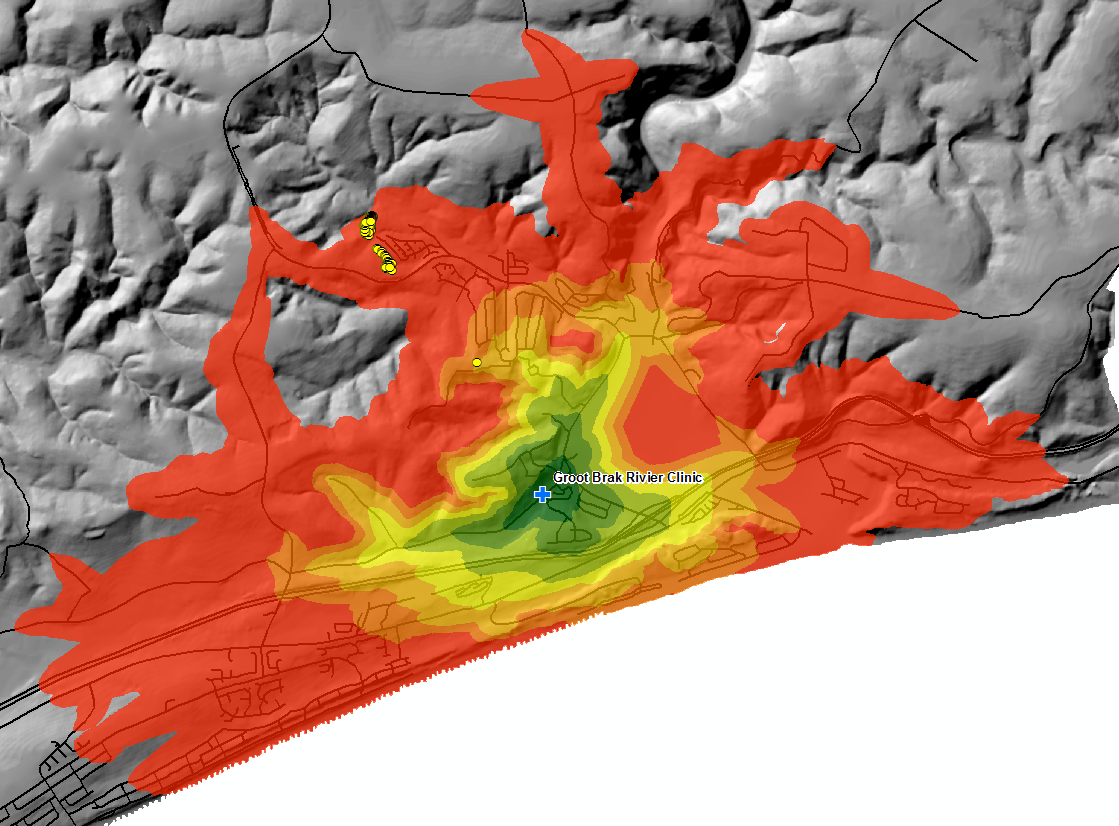
I have generated a summary statistics table based on service area analysis areas (5 min, 10 min, 15min etc) for each settlement area that I'm determining travel times from individual buildings within a settlement to a social facilities (i.e. Clinics, Schools etc)
My output from my summary statistics table has the following columns:
- TOWN = Town Name
- SETTLEMENTNAME = Settlement Name
- NAME = Social Facility Name (i.e. School Name or Health Care Name)
- TIME = Service Area Time Interval ( 5 min, 10 min, 15min - 60 min)
- COUNT_NAME = The number of buildings within each service area (5 min, 10 min - 60 min)
I'd like to convert the following Summary Statistics results table into the following format:
- TOWN
- SETTLEMENTNAME
- NAME
- 0 - 5 MIN = The number of buildings within 0 - 5 min of the Social Facility
- 5 - 10 MIN = The number of buildings within 5 - 10 min of the Social Facility
- 10 - 15 MIN = The number of buildings within 10 - 15 min of the Social Facility
- 15 - 20 MIN = The number of buildings within 15 - 20 min of the Social Facility
- 20 - 25 MIN = The number of buildings within 20 - 25 min of the Social Facility
- 25 - 30 MIN = The number of buildings within 25 - 30 min of the Social Facility
- 30 - 60 MIN = The number of buildings within 30- 60 min of the Social Facility
I've attached a print screen of the Summary Statistics Table as well as the Output Results Table that I'm trying to achieve.
I've briefly read that either Numpy or Pandas would be able to achieve the results that I'm looking for, but I'm a novice with Numpy and have never used Pandas. Any help would be appreciated.
- Mark as New
- Bookmark
- Subscribe
- Mute
- Subscribe to RSS Feed
- Permalink
so a more elaborate multicolumn version of histogram (in numpy).. I have several variants, but look at this first and state what is missing or do you want the output matrix ordered in a different way.
Free Frequency ... join the cause
as indicated before NumPy Repository has other documents for those that are interested in array works
- Mark as New
- Bookmark
- Subscribe
- Mute
- Subscribe to RSS Feed
- Permalink
Hi Dan
Thanks for your assistance once again, truly appreciated. I'm not sure Frequency Analysis is what I looking for. The COUNT_NAME field already has the number of buildings determined for each particular time interval. If you take "Asla Park B" as an example:
Town Settlement Name TIME Field ( 15 - 25 min) TIME Field ( 20 - 25 min)
- Mossel Bay Asla Park B 6 Buildings = COUNT_NAME 148 Buildings = COUNT_NAME
Let me kow if I've not explained it clearly enough. Thanks again 
- Mark as New
- Bookmark
- Subscribe
- Mute
- Subscribe to RSS Feed
- Permalink
sort of fuzzy, but I assume that you are trying to find the Asia Park B's broken down by time zone, I was more interested on the input data form which looks like table you want, but not what you have. I haven't got time right now to check, but there is an abbreviated section on how to take data, sort it by a column and get the counts for other columns, so if you had a bunch of Asia Park B's records with 0 1 or 2 counts which....when summarized... gave you 6 buildings in the 15-25 min time zone and 148 in the 20-25 time zone etc... then it is doable. there is the small problem of your horrid field names... but that is minor. TableToNumPyArray will produce a recarray,, you access fields using a field name (like in Pandas), you can determine the unique entries, and summarize the various columns accordingly. Have a read through some of the samples, and let me know. Of course right now, your table work could be expedited using dcount dsum and the like if the data are already in spreadsheet form, but I find spreadsheet database summary more confusing that array stuff.