- Home
- :
- All Communities
- :
- Developers
- :
- Python
- :
- Python Questions
- :
- Re: Pull one attribute from a featureclass
- Subscribe to RSS Feed
- Mark Topic as New
- Mark Topic as Read
- Float this Topic for Current User
- Bookmark
- Subscribe
- Mute
- Printer Friendly Page
Pull one attribute from a featureclass
- Mark as New
- Bookmark
- Subscribe
- Mute
- Subscribe to RSS Feed
- Permalink
I am a beginner, and the following question will show why.
I am trying to extract one value from a layer that has only one feature in it, but the only way I know how to do it takes three lines of code. There must be a better way, right? See the below code that I am using, and excuse the ignorance.
# pull some attributes from the isolated feature
with arcpy.da.SearchCursor(fcTemp, 'ATTR') as pulllist:
    for pull in pulllist:
        var = pull[0]
- Mark as New
- Bookmark
- Subscribe
- Mute
- Subscribe to RSS Feed
- Permalink
10,000 records,
basically line 1 doesn't count... I could have put line 2 into line 4 and the rest is viewing fluff.
So ignoring blank lines, imports and putting file names on separate lines... line 4 is an data access module incarnation of a searchcursor(ish). The rest is numpy. You can work with numpy (line 6) or pandas... you can view/use it like a list.
import arcpy
in_tbl = r"c:\somepath\some.gdb\sometable"
d = arcpy.da.TableToNumPyArray(in_tbl, "Age") # pull all the `age` data in
d0 = d.view(np.int32)
d0
array([61, 31, 60, 49, 85, 55, 39, ..., 71, 38, 44, 38, 21, 28, 88])
d1 = d0.tolist()
[61, 31, 60, 49, 85, 55, 39, ... huge snip ... , 71, 38, 44, 38, 21, 28, 88]If you just wanted the first value.. you slice line 4 d[0][0]
out = []
with arcpy.da.SearchCursor(in_tbl, 'Age') as pulllist:
for pull in pulllist:
out.append(pull[0])
out[:10] # ---- slice first 10
[61, 31, 60, 49, 85, 55, 39, 20, 63, 19]Timings are comparable if things have been called at least once
%timeit arcpy.da.TableToNumPyArray(in_tbl, "Age") # pull all the `age` data in
9.38 ms ± 398 µs per loop (mean ± std. dev. of 7 runs, 100 loops each)
%%timeit
out = []
with arcpy.da.SearchCursor(in_tbl, 'Age') as pulllist:
for pull in pulllist:
out.append(pull[0])
9.94 ms ± 311 µs per loop (mean ± std. dev. of 7 runs, 100 loops each)- Mark as New
- Bookmark
- Subscribe
- Mute
- Subscribe to RSS Feed
- Permalink
Also, I'm interested in how you're timing the functions.
Can you tell me more about how to measure the time it takes to run not just one command, but my entire script?
- Mark as New
- Bookmark
- Subscribe
- Mute
- Subscribe to RSS Feed
- Permalink
many ways... but just add these to your script
from datetime import datetime
from time import sleep
startTime = datetime.now()
sleep(0.5) # put your code here instead of sleep
print(datetime.now() - startTime)
0:00:00.510107
- Mark as New
- Bookmark
- Subscribe
- Mute
- Subscribe to RSS Feed
- Permalink
Hi Quang,
Here is an example of your code consolidated into 1 line:
var = [row for row in arcpy.da.SearchCursor(fcTemp, 'ATTR')][0][0]- Mark as New
- Bookmark
- Subscribe
- Mute
- Subscribe to RSS Feed
- Permalink
d = arcpy.da.TableToNumPyArray(in_tbl, "Age")[0][0]
# ---- or in your case
var = arcpy.da.TableToNumPyArray(fcTemp, "ATTR")[0][0] which are probably the same under their shells
But
# --- you can get frequency counts
#
h = np.histogram(arcpy.da.TableToNumPyArray(in_tbl, "Age")['Age'])
h # ---- top row counts, bottom bin counts
(array([1495, 1297, 1617, 1710, 1185, 801, 658, 407, 348, 482],
dtype=int64),
array([18. , 25.1, 32.2, 39.3, 46.4, 53.5, 60.6, 67.7, 74.8, 81.9, 89. ]))Or derive statistics that you can't do with searchcursors
v = arcpy.da.TableToNumPyArray(in_tbl, "Age")['Age']
# ---- like the median
v.min(), v.max(), v.std(), np.median(v)
(18, 89, 17.688446350937664, 42.0)Esri provides the tools, but not everyone uses them
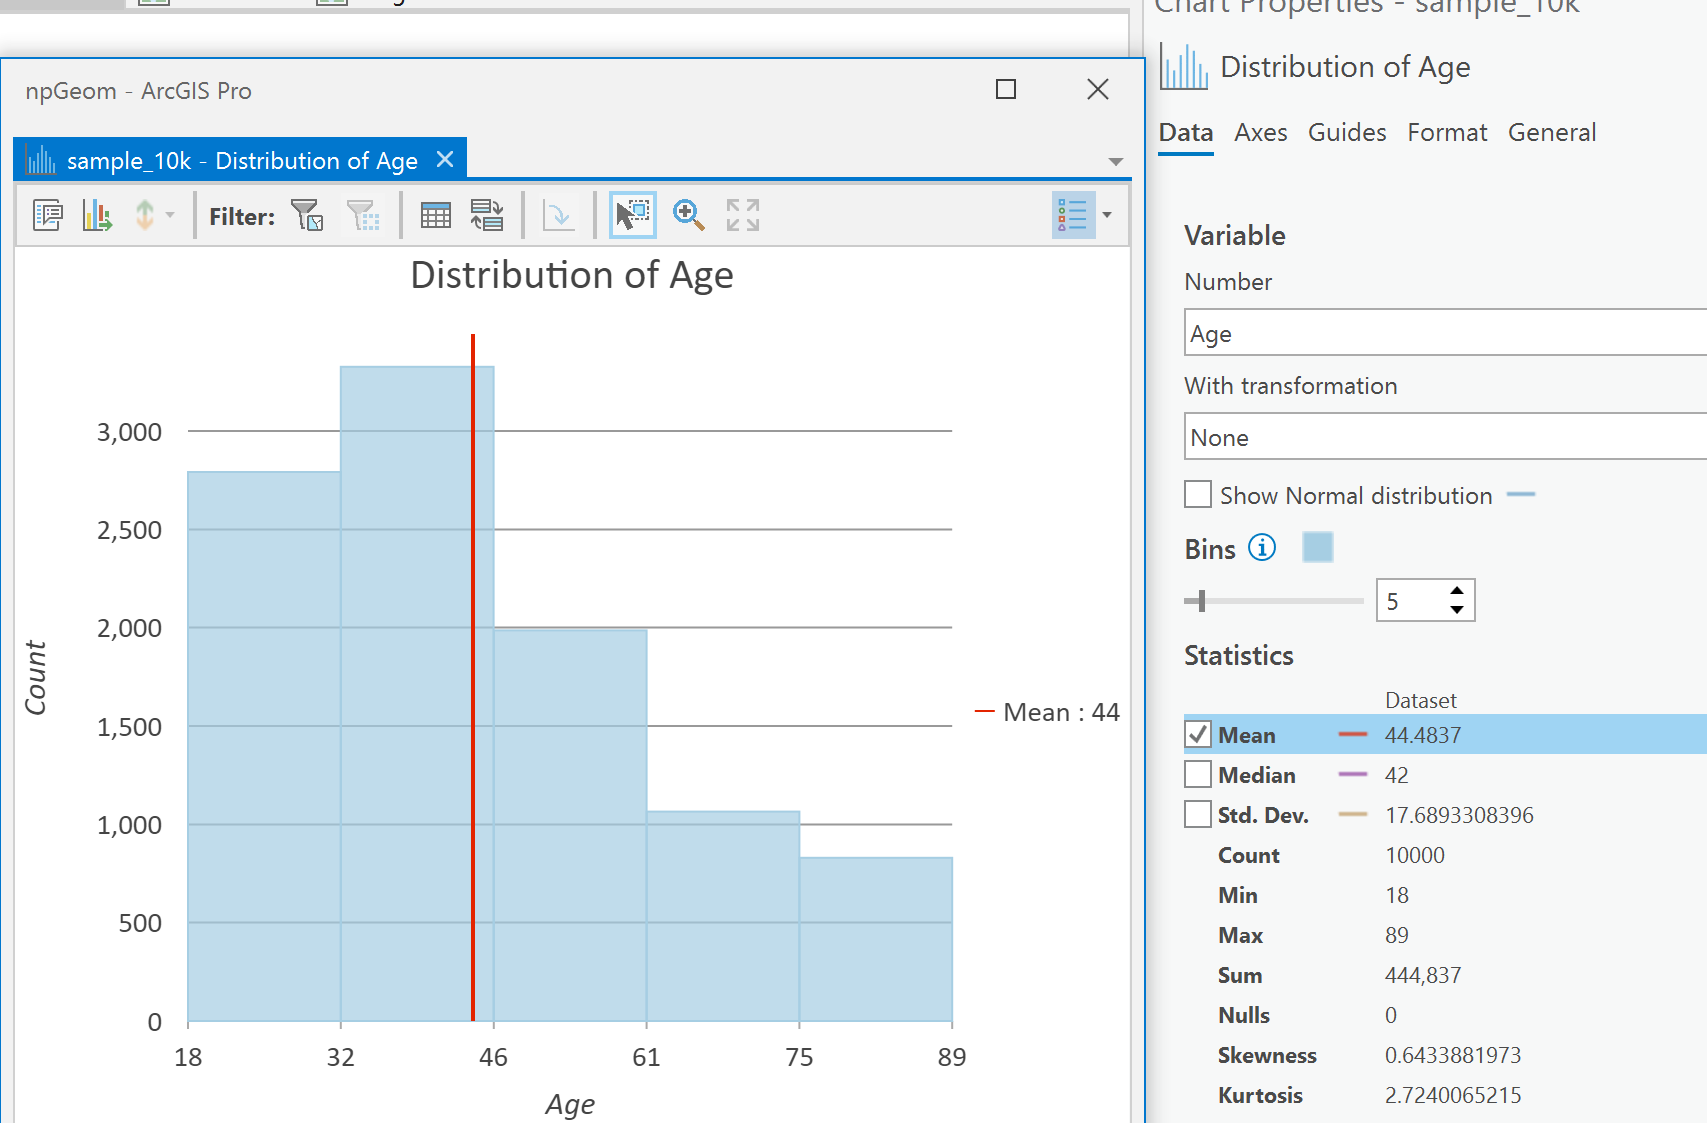
Even access to graphing from the comfort of your favorite IDE or you can do it in ArcGIS Pro and set things and get the statistics there
import matplotlib.mlab as mlab
import matplotlib.pyplot as plt
num_bins = 5
n, bins, patches = plt.hist(v, num_bins, facecolor='blue', alpha=0.5)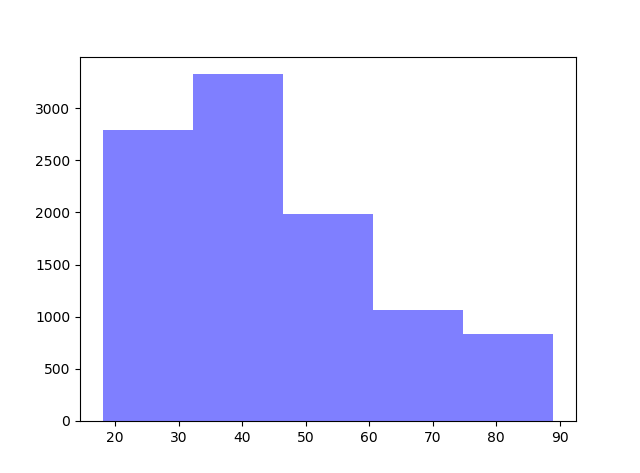
- Mark as New
- Bookmark
- Subscribe
- Mute
- Subscribe to RSS Feed
- Permalink
If you only want to retrieve the first record of a cursor:
var, = next(arcpy.da.SearchCursor(fcTemp, 'ATTR')) # note comma for tuple unpacking- Mark as New
- Bookmark
- Subscribe
- Mute
- Subscribe to RSS Feed
- Permalink
Love a good lesson session
How about every second record?
or the data sorted?
arcpy.da.TableToNumPyArray(in_tbl,"Age")["Age"]
array([61, 31, 60, ..., 21, 28, 88])
arcpy.da.TableToNumPyArray(in_tbl,"Age")["Age"][::2]
array([61, 60, 85, ..., 38, 38, 28])
np.sort(arcpy.da.TableToNumPyArray(in_tbl,"Age")["Age"])
array([18, 18, 18, ..., 89, 89, 89])- Mark as New
- Bookmark
- Subscribe
- Mute
- Subscribe to RSS Feed
- Permalink
These are all super helpful! Thank you guys!
- Mark as New
- Bookmark
- Subscribe
- Mute
- Subscribe to RSS Feed
- Permalink
Please mark one of the responses as Correct or mark the question as "Assumed answer" to close it out.