- Home
- :
- All Communities
- :
- Developers
- :
- Python
- :
- Python Questions
- :
- perform IDW interpolation to select multiple Z fie...
- Subscribe to RSS Feed
- Mark Topic as New
- Mark Topic as Read
- Float this Topic for Current User
- Bookmark
- Subscribe
- Mute
- Printer Friendly Page
perform IDW interpolation to select multiple Z field from attribute table using ArcPy
- Mark as New
- Bookmark
- Subscribe
- Mute
- Subscribe to RSS Feed
- Permalink
I have 12 point feature datasets for different month. I want to perform IDW interpolation.
I have created the python code but its taking only one "Z" field for different month feature datasets from the attribute. Below I have mentioned the code. How to assign here multiple Z field from each month folder (JANUARY, FEBRUARY......DECEMBER).
Point feature class from different month folder (e.g. For January Merged_001, for FEBRUARY Merged_002.......for DECEMBER Merged_012 ) and want to perform IDW interpolation and save it as on same month folder as it Z field name (Max_Temper, Min_Temper, Precipitatat, Wind, Relative_H, Solar) with month (e.g for January 001_Max_Temper, 001_Min_Temper, 001_Precipitatat, 001_Wind, 001_Relative_H, 001_Solar).
After Whatever Solar raster for different month (for January 001_Solar....for DECEMBER 012_Solar) we will get, I want to do some calculation (001_Solar * 30) *0.5 and save it 001_sr ........012_sr in Month wise folder.
Below i have attached Point shapefile also for reference purpose
Here is my code.
import arcpy
from arcpy import env
from arcpy.sa import *
arcpy.env.parallelProcessingFactor = "100%"
arcpy.env.overwriteOutput = True
# Check out the ArcGIS Spatial Analyst extension license
arcpy.CheckOutExtension("Spatial")
env.workspace = "D:\SWAT-WEATHER-DATA2\APRIL"
# Set local variables
inPointFeatures = "D:\SWAT-WEATHER-DATA2\APRIL\Merged_004.shp"
zField = "Min_Temper" #Z_Filed = Max_Temper, Min_Temper, Precipitatat, Wind, Relative_H, Solar
cellSize = 0.002298707671
power = 2
searchRadius = RadiusVariable(10, 150000)
#Mask region of interest
mask="D:\Gujarta Shape file\GUJARATSTATE.shp"
# Execute IDW
outIDW = Idw(inPointFeatures, zField, cellSize, power, searchRadius)
# Execute Mask
IDWMASk = ExtractByMask(outIDW, mask)
# Save output, except Solar Radiation raster
IDWMASk.save("004_Min_Temp.tif")
# 004_Max_Temp.tif, 004_Min_Temp.tif....Solar
#Only for Solar Radiation raster
#PAR = (IDWMASk * 30) * 0.5
#Save output, Only for Solar Radiation raster
#PAR.save("003_sr.tif")
#print done
print 'done'Solved! Go to Solution.
- Mark as New
- Bookmark
- Subscribe
- Mute
- Subscribe to RSS Feed
- Permalink
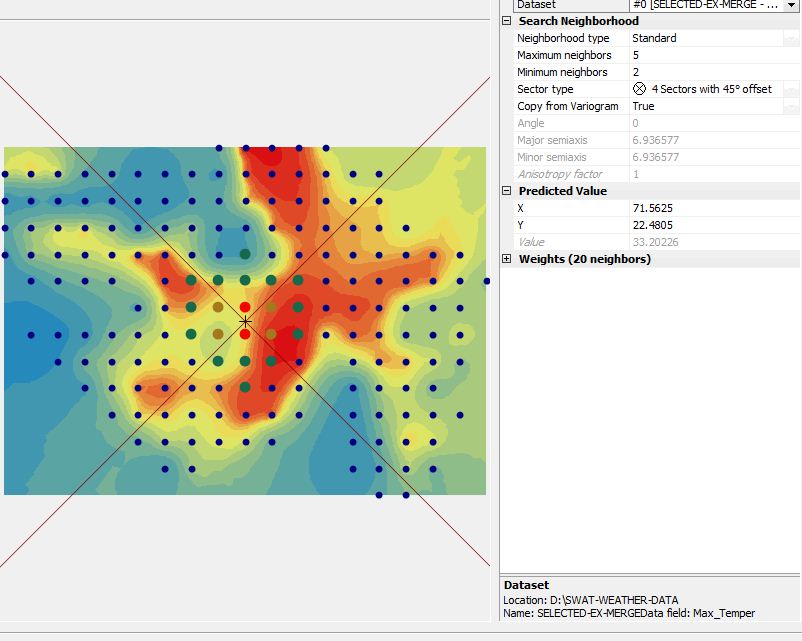
I think you are on the right track, although my Kriging knowledge is a little rusty. I do notice the high variance in the semivariogram (1st image). If the sample points are rather far away from you model line, the estimation (resulting raster) might be off.
- Mark as New
- Bookmark
- Subscribe
- Mute
- Subscribe to RSS Feed
- Permalink
Xander Bakker, Thank you. I tried hard to fix the error of above code for Kriging. But still i am getting same error. My humbly request if you can point out the error by replace the right code.its would be very helpful.
- Mark as New
- Bookmark
- Subscribe
- Mute
- Subscribe to RSS Feed
- Permalink
One of the errors in the code is on line 31. Before kRadius you are missing the cell size.
I adjusted that and used the variables from the images you posted, but I am getting the error:
ExecuteError: ERROR 010079: Unable to estimate semivariogram.
Failed to execute (Kriging).
As you can read here: 010079: Unable to estimate semivariogram.—Help | ArcGIS for Desktop this can probably be resolved by increasing the cellsize (and the search radius). I will have a look at this later.
- Mark as New
- Bookmark
- Subscribe
- Mute
- Subscribe to RSS Feed
- Permalink
Considering we started with something like this, which was speculated to have come from an already interpolated dataset :
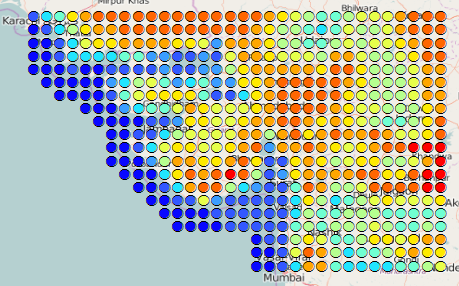
And now we are on to Kriging wotsitzs.
And via scripting? Aside from the fact that I think that Kriging this data is way too much, why not just use the normal GUI tools until you are more experienced with the millions of options.
Got too far..... 
- Mark as New
- Bookmark
- Subscribe
- Mute
- Subscribe to RSS Feed
- Permalink
Thank you for the suggestion . But i am working on 30 years satellite data sets . So without python its very time consuming and error may occur. If once we can trained the programme then process would be very smooth.
- Mark as New
- Bookmark
- Subscribe
- Mute
- Subscribe to RSS Feed
- Permalink
xander_bakker. Thank you for the cooperating. I am still trying to get solution. one Humbly request to you, looking for solution if possible.
- Mark as New
- Bookmark
- Subscribe
- Mute
- Subscribe to RSS Feed
- Permalink
The code will probably work (in theory), if you include the cell size as I mentioned before. What will produce problems are the semivariogram parameters. According to the documentation this can be resolved increasing the cell size. However, I tried some settings and all resulted in the same error 010079. To resolve this you should model the semivariogram. This should be done for ALL the field and values you want to model, since distribution of the values in space will be different. I do not have access to the tools to do this. This will take a considerable amount of time, and if we consider the origin of the data I would have to agree with GSCUser85 and his comment earlier... Kriging is most likely not going to be the solution.
- Mark as New
- Bookmark
- Subscribe
- Mute
- Subscribe to RSS Feed
- Permalink
xander_bakker. I think so Kriging is not to be solution. I ran the code by 0.05 cell size. but i think its not probably the solution, I keep continue my research on this subject until resolve the issues. Thank you very much for you kind cooperation.
- « Previous
- Next »
- « Previous
- Next »