- Home
- :
- All Communities
- :
- Developers
- :
- Python
- :
- Python Questions
- :
- Re: Max value of time series raster and date infor...
- Subscribe to RSS Feed
- Mark Topic as New
- Mark Topic as Read
- Float this Topic for Current User
- Bookmark
- Subscribe
- Mute
- Printer Friendly Page
Max value of time series raster and date information
- Mark as New
- Bookmark
- Subscribe
- Mute
- Subscribe to RSS Feed
- Permalink
Hi,
I have daily rainfall data in a year in geotiff format with file naming convention "rainfall_yyyymmdd.tif" and I would like to get maximum rainfall value per year per pixel and information about which date the max value came from.
Getting the max value is doable using Cell Statistics, but how to get information about date of the max value?
I am planning to do the calculation for 36 years data (1981 - 2017).
Thank you, Benny
raster timeseries arcpy python cellstatistics precipitation rainfall
Solved! Go to Solution.
Accepted Solutions
- Mark as New
- Bookmark
- Subscribe
- Mute
- Subscribe to RSS Feed
- Permalink
Benny... do a manual check.
Set the color ramp for the max to 'Precipitation'
The other raster is the 'day' that the maximum occurred.
Let me know... it takes less than 30 seconds to do a run... 30 * 30 is less time to automate it to do
everything 
you just need make folders in line 44, 45... put all the raster folders into line 44's folder and the results have to go into a separate folder
# -*- coding: utf-8 -*-
"""
climate
=======
Script : climate.py
Author : Dan_Patterson@carleton.ca
Modified : 2018-07-30
Purpose:
Process daily climate data... for this time, the daily max by
location. Bali, is the locale.
Useage :
References
----------
`<https://community.esri.com/thread/218763-max-value-of-time-series-raster-
and-date-information#comment-788295>`_.
`<http://www.bali-paradise.com/news/weather/`>_.
`<http://pro.arcgis.com/en/pro-app/arcpy/data-access/numpyarraytotable.htm>`_.
`<http://pro.arcgis.com/en/pro-app/arcpy/data-access/tabletonumpyarray.htm>`_.
---------------------------------------------------------------------
"""
import sys
import numpy as np
import arcpy
arcpy.env.overwriteOutput = True
ft = {'bool': lambda x: repr(x.astype(np.int32)),
'float_kind': '{: 0.3f}'.format}
np.set_printoptions(edgeitems=5, linewidth=120, precision=2, suppress=True,
threshold=100, formatter=ft)
np.ma.masked_print_option.set_display('-') # change to a single -
script = sys.argv[0] # print this should you need to locate the script
# ---- You need to specify the folder where the tif files reside ------------
#
src_flder = r"C:\Temp\climate\1981" # just change the year
out_flder = r"C:\Temp\climate\Results" # make a result folder to put stuff
out_year = src_flder.split("\\")[-1]
max_name = "{}\\Bali_{}max.tif".format(out_flder, out_year)
date_name = "{}\\Bali_{}_day.tif".format(out_flder, out_year)
# ---- Process time ----
arcpy.env.workspace = src_flder
rasters = arcpy.ListRasters()
arrs = []
for i in rasters:
r = arcpy.RasterToNumPyArray(i, nodata_to_value=0.0)
arrs.append(r)
# ---- Convert to an integer dtype since the float precision is a bit much
a = np.array(arrs)
m = np.where(a > 0., 1, 0)
a_m = a * m
a_m = np.ndarray.astype(a_m, np.int32)
a_max = np.max(a_m, axis=0)
a_w = np.argmax(a_m, axis=0)
a_when = np.ndarray.astype(a_w, np.int32)
out_max = arcpy.NumPyArrayToRaster(a_max,
arcpy.Point(114.4317366,-8.8492618),
x_cell_size=0.049242234706753,
y_cell_size=0.049242234706753,
value_to_nodata=0)
out_max.save(max_name)
out_when = arcpy.NumPyArrayToRaster(a_when,
arcpy.Point(114.4317366,-8.8492618),
x_cell_size=0.049242234706753,
y_cell_size=0.049242234706753,
value_to_nodata=0)
out_when.save(date_name)
del a, m, a_m, a_max, a_w, a_when, max_name, date_name, out_max, out_when
# ---- repeat ad nauseum since this is free ;)- Mark as New
- Bookmark
- Subscribe
- Mute
- Subscribe to RSS Feed
- Permalink
How comfortable are you with numpy?
You could make a 3d array (year, x, y) and determine the max of that easily, then there is an argmax function in numpy that will tell you the 'where' the max occurs... in your case, you could end up with a final array with the max value and the year that the max occurred on a yearly basis.
If you aren't, then it would be possible to just compare the max raster in a loop to find the year that the max values occurred.
- Mark as New
- Bookmark
- Subscribe
- Mute
- Subscribe to RSS Feed
- Permalink
Hi Dan, thank you for reply
I am not familiar with numpy and friend, I can only use script, without knowledge write a code. You and Xander Bakker always helping me solve my previous problem  My latest question to you and Xander about "percentile from raster timeseries".
From your suggestion, which tool should I use to compare? Is it doable using Model Builder raster iteration?
Benny
- Mark as New
- Bookmark
- Subscribe
- Mute
- Subscribe to RSS Feed
- Permalink
ahhh yes How to calculate the percentile for each cell from timeseries raster
# ---- lines 19 and 20
a_m = np.array(arrs_m)
a_max = np.nanmax(a_m, axis=0)
# ------ now an example --------------------
a = np.random.randint(1, 10, size=(4, 5, 6))
a # ---- years
array([[[6, 4, 7, 1, 1, 1],
[1, 1, 3, 9, 6, 7],
[1, 6, 9, 9, 3, 6],
[6, 8, 3, 5, 8, 4],
[5, 8, 7, 6, 1, 5]],
[[9, 1, 6, 7, 9, 1],
[1, 3, 7, 8, 2, 9],
[2, 1, 8, 7, 5, 3],
[7, 9, 1, 3, 6, 4],
[1, 2, 1, 2, 2, 1]],
[[9, 9, 3, 4, 3, 6],
[2, 3, 9, 6, 5, 1],
[7, 8, 8, 5, 1, 7],
[6, 7, 2, 8, 4, 6],
[1, 8, 1, 8, 6, 2]],
[[3, 4, 5, 2, 6, 1],
[6, 3, 2, 6, 9, 2],
[3, 4, 9, 3, 7, 7],
[6, 4, 4, 9, 6, 3],
[6, 9, 2, 2, 4, 8]]])
a_max = np.nanmax(a, axis=0)
a_max # ---- The maximum by location regardless of year
array([[9, 9, 7, 7, 9, 6],
[6, 3, 9, 9, 9, 9],
[7, 8, 9, 9, 7, 7],
[7, 9, 4, 9, 8, 6],
[6, 9, 7, 8, 6, 8]])
# ---- now the 'time' that the max occurred
np.argmax(a, axis=0)
Out[8]:
array([[1, 2, 0, 1, 1, 2],
[3, 1, 2, 0, 3, 1],
[2, 2, 0, 0, 3, 2],
[1, 1, 3, 3, 0, 2],
[3, 3, 0, 2, 2, 3]], dtype=int64)Now this requires interpretation...
let's look at line 37 row 0
9, 9, 7, 7, 9, 6
now line 47 row 0
1, 2, 0, 1, 1, 2
the max occurred at those locations at.
For example top left corner, max is 9 and the time period was 1 (counting from 0 )
next over, max is 9, time period was 2
next over, max is 7, time first period 0
next over, max is 7, time period 1
next over, max is 9, time period 1
and the last, max is 6, time period 2
repeat.
Now if you want to find out which time period had the most maximums by location... I can do that.
If you want to see if there is any clustering spatially in the time of maximum... ditto
how about …. fill in the blank …..
So see if you can resurrect the thread and give it whirl yourself
- Mark as New
- Bookmark
- Subscribe
- Mute
- Subscribe to RSS Feed
- Permalink
Thank you Dan, I understand the logic but still hard for me to think the next step.
Let me try to do it manually for 1 year using Excel, and will see how long it takes to do it.
- Mark as New
- Bookmark
- Subscribe
- Mute
- Subscribe to RSS Feed
- Permalink
why don't you zip and attach a year or two of the tif files to your original post
- Mark as New
- Bookmark
- Subscribe
- Mute
- Subscribe to RSS Feed
- Permalink
Done!
I try to make it small, its only daily rainfall for Bali island 1981-1982
- Mark as New
- Bookmark
- Subscribe
- Mute
- Subscribe to RSS Feed
- Permalink
Benny … 1981 max …
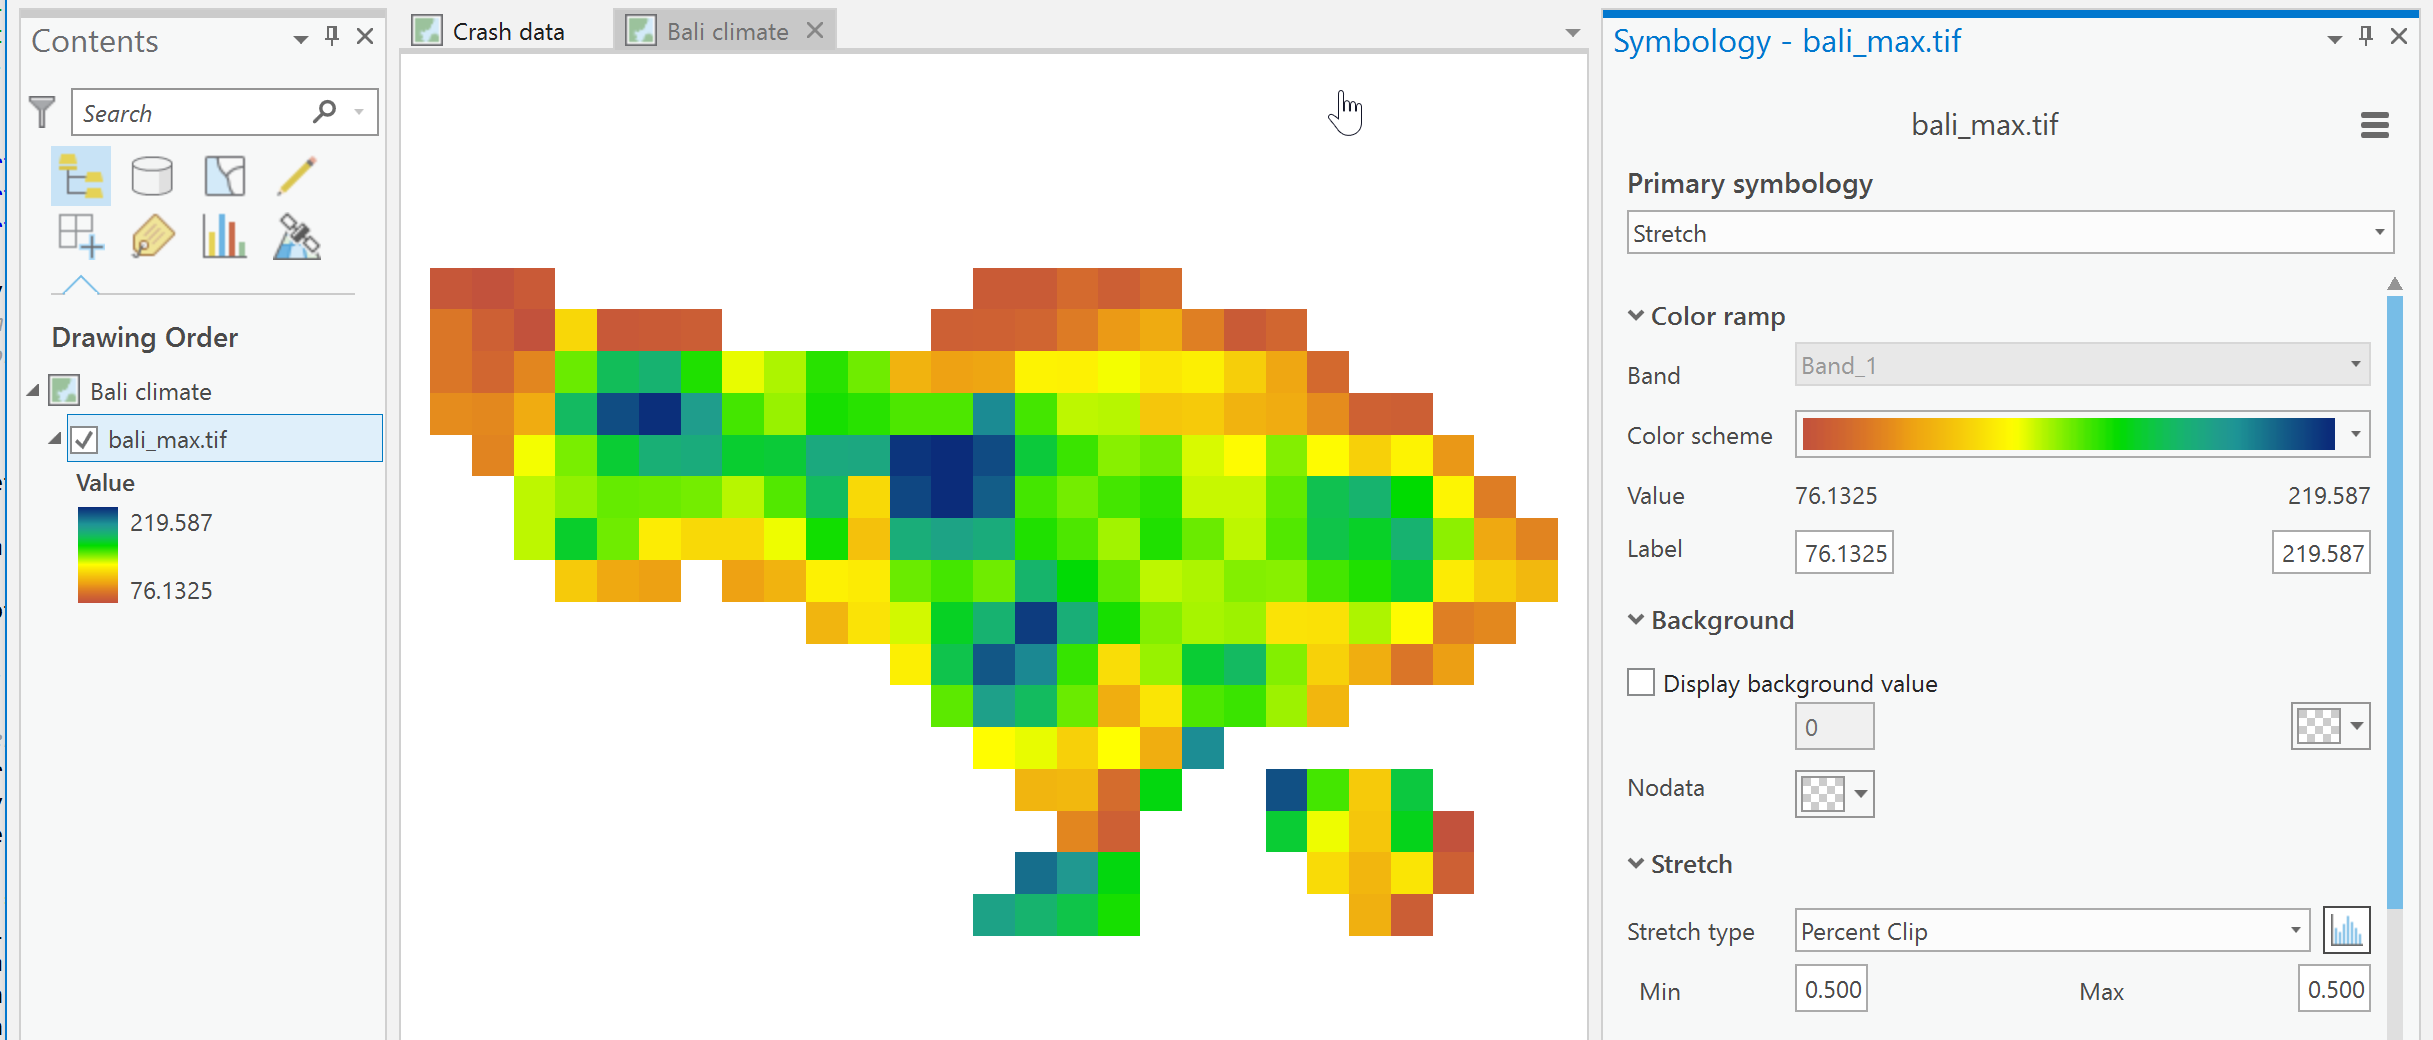
Looks ok?
I will spruce itup after you give the ok.
I had to make some minor changes to the code to simplify a few things.
Now... do you really need the precision to 1/100 of a millimeter?  or would the nearest mm be ok?
- Mark as New
- Bookmark
- Subscribe
- Mute
- Subscribe to RSS Feed
- Permalink
Perfectly match with manual process using CellStatistics MAX. Nearest mm its acceptable.
Thank you Dan!
- Mark as New
- Bookmark
- Subscribe
- Mute
- Subscribe to RSS Feed
- Permalink
I will finish it up by the end of the day