Turn on suggestions
Auto-suggest helps you quickly narrow down your search results by suggesting possible matches as you type.
Cancel
- Home
- :
- All Communities
- :
- Developers
- :
- Python
- :
- Python Questions
- :
- Re: Likely Simple Python Question: dynamically sel...
Options
- Subscribe to RSS Feed
- Mark Topic as New
- Mark Topic as Read
- Float this Topic for Current User
- Bookmark
- Subscribe
- Mute
- Printer Friendly Page
Likely Simple Python Question: dynamically selecting records
Subscribe
12-12-2013
12:05 PM
- Mark as New
- Bookmark
- Subscribe
- Mute
- Subscribe to RSS Feed
- Permalink
Hello,
I have a question that is likely very easily solved with some Python coding....I just have no experience in the area. It was suggested in the General Forum that I post my question here.
Is there a way to dynamically select records based on a field set in Data Driven Pages? I have a graph in my layout that I want to update with each scroll with each "Next Page". I have a table set up with a page definition query for the data I want graphed. Unfortunately, the graph still plots all records, not just the ones displayed with the page definition query. So, for example, even though (with the page definition query) my table displays records only from Station_ID = 101, the graphs displays records from all Station_IDs. The graph only works properly (displaying only Station_ID = 101 items) if they are manually selected.
Is there anyway to automate this? I'm guessing there's an easy Python code I could run to manage this....
Thanks in advance and please ask questions if I haven't made myself clear!
Katie
Solved! Go to Solution.
1 Solution
Accepted Solutions
01-07-2014
08:46 AM
- Mark as New
- Bookmark
- Subscribe
- Mute
- Subscribe to RSS Feed
- Permalink
Hello all,
I got the code working and wanted to share - in case it helps the next person down the road. I couldn't get the extension code, but this button works as well. A big clunkier, but works all the same. It was very simple in the end. Thanks so much Wayne and PSArcOnline!
I got the code working and wanted to share - in case it helps the next person down the road. I couldn't get the extension code, but this button works as well. A big clunkier, but works all the same. It was very simple in the end. Thanks so much Wayne and PSArcOnline!
import arcpy import pythonaddins class Selection(object): """Implementation for SelectAllButton_addin.button (Button)""" def __init__(self): self.enabled = True self.checked = False def onClick(self): # Select all features (in Test there are no features with FID 0). arcpy.SelectLayerByAttribute_management ("XYMin_Max_Avg_Temp_with_Lat_Long","NEW_SELECTION","Station_Id"<>'0') pass
16 Replies
12-12-2013
02:40 PM
- Mark as New
- Bookmark
- Subscribe
- Mute
- Subscribe to RSS Feed
- Permalink
Any way you can post a small sample of your data, zip and attach here...maybe with some illustrative screen shots to help clarify your problem? Not sure if it can be done with Python exactly but give us more to go on in order to confirm that conclusion. Also, I don't think you said what version of ArcMap you're using?
I ran across this, haven't tested it out though:
DDPwithDynamicTablesAndGraphs_10.1_v1
http://www.arcgis.com/home/item.html?id=3a525b986b774a3f9cbbd8daf2435852
I ran across this, haven't tested it out though:
DDPwithDynamicTablesAndGraphs_10.1_v1
http://www.arcgis.com/home/item.html?id=3a525b986b774a3f9cbbd8daf2435852
12-13-2013
06:32 AM
- Mark as New
- Bookmark
- Subscribe
- Mute
- Subscribe to RSS Feed
- Permalink
Hello,
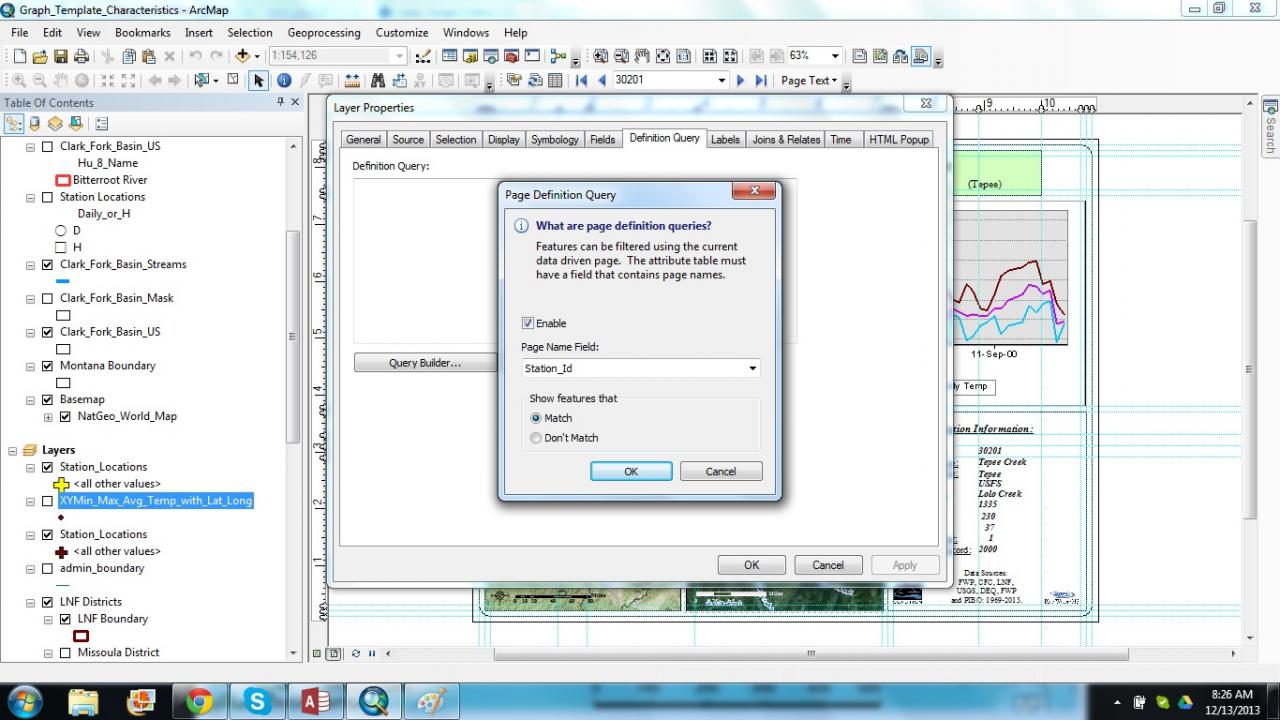
Thanks so much for your reply Wayne. I'm using ArcGIS 10.2 and here are some screen shots of the project. The XYMin_Max_Avg_Temp_WithLatLong table is the data I am graphing on the chart (avg/min/max temperatures). I have this table in a Page Definition Query based on the Station_Id. As I move through the next page, it advances the Station_Id and the maps are updated based on the station locations. The XY_Min_Max_Avg...table updates to the next Station_ID as well, but the temperatures do not graph. **Screen Shot of the project with Table**
In the graphing properties, I have the "Show only selected features/record on graph" selected. **Screen Shot of Graph Properties Page**Unfortunately, even though the temperatures I want graphed are selected via the Page Definition, they apparently need to be selected via an actual 'selection' (via by attributes or other). **Screen Shot of Page Definition for XY_Min_Max_Temp...Table**
So....it seems to me that perhaps a python script could be developed that selected records in the XY_Min_Max_Temp...table based on the Station_ID selected in the current Data Driven Page. Perhaps there is an easier solution (that would be amazing). Please ask more questions if I've just muddied the water further. Thanks so much!
[ATTACH=CONFIG]29858[/ATTACH][ATTACH=CONFIG]29859[/ATTACH][ATTACH=CONFIG]29860[/ATTACH]
12-13-2013
07:13 AM
- Mark as New
- Bookmark
- Subscribe
- Mute
- Subscribe to RSS Feed
- Permalink
Hello Katie,
No sample data you can zip/attach?...I don't know if I'll have time to look at this further today, but the screenshots (which I haven't opened yet) should help.
Did you look at the link from my last post -- looks like something for you to investigate and since you're at 10.2, you should be able to leverage the part about 'dynamic graphs and tables'. That was in their 1st bullet point (this was produced by the MapAutomationTeam, which I'm assuming is ESRI ?):
"Arcpy.mapping now allows for cloning of text and graphic elements. This makes it possible to generate truly dynamic tables and graphs."
I didn't look yet at what the MapAutomationTeam provided either, but it looks promising....hope that helps, check it out.
-Wayne
12-13-2013
10:52 AM
- Mark as New
- Bookmark
- Subscribe
- Mute
- Subscribe to RSS Feed
- Permalink
Hi Wayne,
I have opened and looked at the DDPwithDynamicTablesAndGraphs_10.1_v1 (by the MapAutomationTeam). It's a great product....but far over my head as far as trying to interpret their coding, then adapting to my needs. I've tried creating a Python add-in toolbar/button that simply selects the records in the XY_Min_Max_Temp.... table. So far, my toolbar shows up but the button says "Missing" so my code is obviously in error. Argh!
If some data would help I would gladly attach it, but I have so many layers I'm not sure what would be helpful to attach. The screenshot in the last post showed the main table I am working with. Thanks for your help and thoughts, Wayne.
Thanks,
Katie
12-13-2013
10:56 AM
- Mark as New
- Bookmark
- Subscribe
- Mute
- Subscribe to RSS Feed
- Permalink
Katie, have you made any progress with this yet? It's an interesting problem.
Not sure how much (or how little, as you say) experience at this point in time with arcpy -- maybe you've been experimenting since your last post? I took a cursory look at the sample provided by the MapAutomationTeam -- sometimes the best way to get started is to look at script samples.
The script they provided is very short - again not sure how familiar you are right now, particularly pertaining to DDP, but the team is leveraging the 'pagerow' property get, see the webhelp at this link pertaining to DDP and see where 'pagerow' is listed:
DataDrivenPages (arcpy.mapping)
Desktop » Geoprocessing » ArcPy » Mapping module
http://resources.arcgis.com/en/help/main/10.2/index.html#//00s300000030000000
Using this read-only property, you can "...return the index layer's row object for the active or current page." ---- so that 'row' obj would be returned something like this:
...but why you'd be interested in the current index page's row object is to get at one of the field values, say if there's a field called Station_ID - then fetch that value like so (continued from the code above):
Similarly, if this makes sense from the webhelp Code section (from the webhelp link provided above; scroll to the bottom of the page), see the 2nd sample (DataDrivenPages example 2) and see where the line performing the same function to fetch a desired field value from the current index page row - it's shortened a bit by combining on a single line part of that already shown above:
...so I'm going to make a slight jump here to the MapAutomationTeam code sample, if you've downloaded that. See the section of code, called 'Modify bar chart', in the script the team provides (StandAlone_FullMapSeries.py) - it's pasted here (I added one comment to separate the 2 graphic elements being modified):
This code snippet uses pageRow to 'mine' the field 'HisPer2000' for every page and update, or in other words, dynamically create the bar chart for the current page...2 bars were modified based on the values found in the 2 fields, HisPer2000 and HisPer2010.
That is the mechanism for controlling the graph...and that is within the looping block, if you understand that, set up by the statement:
Make sense?...if may be a little daunting at 1st, but that's why you should probably post a small sample of your data and mxd, so you'll have a directly relevant demo you can then experiment directly with. This is actually an invaluable device for including in any reports, etc., that your org requires...and why I am interested.
Hope that helps.
Wayne
EDIT:
Based on your last response, which you posted before my current (last) post...
You do not need an add-in. Likely, you'd just create either a script tool or a stand-alone script --- important thing to realize here is the script is 'dynamically' updating your graph by manipulating the elements based on the current page index values. So as DDP is 'aware' of pages based on your index layer, the script 'links' the graph to those individual pages, so to speak, via 'looking up' values from the index page (the current row), modifying the graph accordingly, then exporting output...
Not sure how much (or how little, as you say) experience at this point in time with arcpy -- maybe you've been experimenting since your last post? I took a cursory look at the sample provided by the MapAutomationTeam -- sometimes the best way to get started is to look at script samples.
The script they provided is very short - again not sure how familiar you are right now, particularly pertaining to DDP, but the team is leveraging the 'pagerow' property get, see the webhelp at this link pertaining to DDP and see where 'pagerow' is listed:
DataDrivenPages (arcpy.mapping)
Desktop » Geoprocessing » ArcPy » Mapping module
http://resources.arcgis.com/en/help/main/10.2/index.html#//00s300000030000000
Using this read-only property, you can "...return the index layer's row object for the active or current page." ---- so that 'row' obj would be returned something like this:
# your map obj, based on an input pathname:
mxd = arcpy.mapping.MapDocument(r'your mxd pathname goes here')

# fetching the row obj of your current DDP index page:
currentRow = mxd.dataDrivenPages.pageRow
...but why you'd be interested in the current index page's row object is to get at one of the field values, say if there's a field called Station_ID - then fetch that value like so (continued from the code above):
currentStation = currentRow.Station_ID
Similarly, if this makes sense from the webhelp Code section (from the webhelp link provided above; scroll to the bottom of the page), see the 2nd sample (DataDrivenPages example 2) and see where the line performing the same function to fetch a desired field value from the current index page row - it's shortened a bit by combining on a single line part of that already shown above:
# 'TSR' is the fieldname the value is fetched from in this case
fieldValue = mxd.dataDrivenPages.pageRow.TSR
...so I'm going to make a slight jump here to the MapAutomationTeam code sample, if you've downloaded that. See the section of code, called 'Modify bar chart', in the script the team provides (StandAlone_FullMapSeries.py) - it's pasted here (I added one comment to separate the 2 graphic elements being modified):
# Modify bar chart
his2000 = float(mxd.dataDrivenPages.pageRow.HisPer2000)
bar1.elementHeight = (his2000 / 50)*2
bar1txt.text = "(" + str(round(his2000, 2)) + ")"
bar1txt.elementPositionY = bar1.elementPositionY + bar1.elementHeight + 0.1

# comment I added:
# 2nd bar element modified, same line formatting as above 4 lines
his2010 = float(mxd.dataDrivenPages.pageRow.HisPer2010)
bar2.elementHeight = (his2010 / 50)*2
bar2txt.text = "(" + str(round(his2010, 2)) + ")"
bar2txt.elementPositionY = bar2.elementPositionY + bar2.elementHeight + 0.1
This code snippet uses pageRow to 'mine' the field 'HisPer2000' for every page and update, or in other words, dynamically create the bar chart for the current page...2 bars were modified based on the values found in the 2 fields, HisPer2000 and HisPer2010.
That is the mechanism for controlling the graph...and that is within the looping block, if you understand that, set up by the statement:
#Loop through each DDP page
for pageNum in range(1, mxd.dataDrivenPages.pageCount + 1):
Make sense?...if may be a little daunting at 1st, but that's why you should probably post a small sample of your data and mxd, so you'll have a directly relevant demo you can then experiment directly with. This is actually an invaluable device for including in any reports, etc., that your org requires...and why I am interested.
Hope that helps.
Wayne
EDIT:
Based on your last response, which you posted before my current (last) post...
You do not need an add-in. Likely, you'd just create either a script tool or a stand-alone script --- important thing to realize here is the script is 'dynamically' updating your graph by manipulating the elements based on the current page index values. So as DDP is 'aware' of pages based on your index layer, the script 'links' the graph to those individual pages, so to speak, via 'looking up' values from the index page (the current row), modifying the graph accordingly, then exporting output...
12-13-2013
12:39 PM
- Mark as New
- Bookmark
- Subscribe
- Mute
- Subscribe to RSS Feed
- Permalink
Katie, are you still listening?
I looked at your pics again - I think I saw a clue in your very 1st screenshot. All records were selected. So it seems you need something to 'reselect' the records based on the page definition; this will potentially update the related graph (which may be easier than 'reconstructing' the elements as in the bar graph sample I was talking about in my last post). Is that not what you were basically trying to tell me? (See how dense I am without test data? lol!)
I'm not sure this is the best way, and I'd have to test with a sample I'll try to make up over the weekend (if I have time). It seems the problem is the graph will update only based on a selection...it won't update based on the page def query alone, if you refresh the DDP? Try that. Otherwise, making sure the selected set is the same as that defined by the page def query may be the workaround - and that, as shown last post, can be based on the pageRow fetch on Station_ID.
That helping any? It's okay - we're pretty fortunate to have access to so many fine-tuning options via Python in order to produce many different kinds of output, amazing actually.
-Wayne
12-13-2013
01:09 PM
- Mark as New
- Bookmark
- Subscribe
- Mute
- Subscribe to RSS Feed
- Permalink
Hi Wayne,
I so greatly appreciate your help....but I really have zero Python experience. I spent a few hours trying to develop an 'add-in', which was suggested by someone else in the general forum (where I posted originally), and it sounds like from your last response that it was wasted time. *Sigh*
I have spent time looking at the script code from the MapAutomationTeam, but it's all a bit much for someone brand new to coding. I only need to select the current records with each 'page next'. At this point, I think my time is best spent hand selecting the necessary data for each page. I'm sorry! I was falsely under the impressing this would be a much easier fix. I do appreciate all your help!
- Katie
12-15-2013
11:40 PM
- Mark as New
- Bookmark
- Subscribe
- Mute
- Subscribe to RSS Feed
- Permalink
.... So it seems you need something to 'reselect' the records based on the page definition; .... It seems the problem is the graph will update only based on a selection ....
Hello Wayne,
I have a similar problem as Katie. And exactly the Quote above is the tricky part. My solution is a button, selecting all entries of the attribute table which includes the values for the graphs. These layer will "hide" all unused lines in the attribut table via "Definition Query - Page Definition". So this is not completely automatically.
The project you mentioned is very interesting, i will take a closer look.
The easiest way would be an option in the graph settings. "Show only selected features/record on the graph" additional: "Show only features/records based of DDP Index". Like for pictures, selecting a path from a Data Driven Pages field.
12-16-2013
08:06 PM
- Mark as New
- Bookmark
- Subscribe
- Mute
- Subscribe to RSS Feed
- Permalink
I developed some short Python add-in code that isn't very sophisticated but seems to do the trick to select the records defined by the page definition query (the workaround stated above) -- I didn't include any code to select any features on opening the mxd, so you'll either have to 'toggle' the page to initialize the selection or enter the 'on open' code in the add-in yourself (or manually select the current page's relevant graph records, save and close the mxd).
Here it is below, hard-coded for the 1st listed data frame and a temperature layer by station listed by the name, 'tempsStation' (you'll need to change that) - by the way, I think this graph can be based on just a table (not a feature layer), as long as the page definition query is also applied (via your Station_Id)...I can explain the logic later if you like, or if you have better logic certainly let me know. The 1st time I implemented this with 'pageIndexExtentChanged' alone and created an infinite loop, so devised a way to 'disable' the object by toggling self.enabled.
This was implemented with a wizard, downloaded from the following:
Python Add-In Wizard
Desktop Application Template by teampython
Last Modified: June 12, 2013
http://www.arcgis.com/home/item.html?id=5f3aefe77f6b4f61ad3e4c62f30bff3b
If you need some sort of 'quick-start' on installation, just let me know...otherwise there's good help here (this is an 'application extension' add-in):
http://resources.arcgis.com/en/help/main/10.2/index.html#/Application_Extension/014p00000019000000/
You can read all the subtopics of Python Add-Ins starting here--
http://resources.arcgis.com/en/help/main/10.2/index.html#/What_is_a_Python_add_in/014p00000025000000...
...but I found the testing and debugging sections most useful:
http://resources.arcgis.com/en/help/main/10.2/index.html#/Testing_an_add_in/014p00000026000000/
http://resources.arcgis.com/en/help/main/10.2/index.html#/Debugging_Python_add_ins/014p0000001n00000...
Hope that helps,
Wayne
EDIT:
Something I forgot to mention - what if you had multiple graphs?
This line in the code accommodates a single layer's graph:
lyr = arcpy.mapping.ListLayers(mxd, 'tempsStation', df)[0]
So if you had multiple graphs by various sources (within the same data frame) you could still use ListLayers, then loop on the designated layers to run the selection command. If in different dataframes, then you'd likely have a nested loop- a loop running on the layers inside a loop running on the specific data frames (return on ListDataFrames).
Here it is below, hard-coded for the 1st listed data frame and a temperature layer by station listed by the name, 'tempsStation' (you'll need to change that) - by the way, I think this graph can be based on just a table (not a feature layer), as long as the page definition query is also applied (via your Station_Id)...I can explain the logic later if you like, or if you have better logic certainly let me know. The 1st time I implemented this with 'pageIndexExtentChanged' alone and created an infinite loop, so devised a way to 'disable' the object by toggling self.enabled.
import arcpy
import pythonaddins

class ExtensionClass1(object):
    """Implementation for testAddIn_addin.extension2 (Extension)"""
    def __init__(self):
        self.enabled = True
    def beforePageIndexExtentChange(self, old_id):
        if self.enabled == False:
            self.enabled = True
        pass
    def pageIndexExtentChanged(self, new_id):
        if self.enabled:
            mxd = arcpy.mapping.MapDocument("Current")
            df = arcpy.mapping.ListDataFrames(mxd)[0]
            lyr = arcpy.mapping.ListLayers(mxd, 'tempsStation', df)[0]
            arcpy.SelectLayerByLocation_management(lyr, '', '', '', 'SWITCH_SELECTION')
            self.enabled = False
        pass
This was implemented with a wizard, downloaded from the following:
Python Add-In Wizard
Desktop Application Template by teampython
Last Modified: June 12, 2013
http://www.arcgis.com/home/item.html?id=5f3aefe77f6b4f61ad3e4c62f30bff3b
If you need some sort of 'quick-start' on installation, just let me know...otherwise there's good help here (this is an 'application extension' add-in):
http://resources.arcgis.com/en/help/main/10.2/index.html#/Application_Extension/014p00000019000000/
You can read all the subtopics of Python Add-Ins starting here--
http://resources.arcgis.com/en/help/main/10.2/index.html#/What_is_a_Python_add_in/014p00000025000000...
...but I found the testing and debugging sections most useful:
http://resources.arcgis.com/en/help/main/10.2/index.html#/Testing_an_add_in/014p00000026000000/
http://resources.arcgis.com/en/help/main/10.2/index.html#/Debugging_Python_add_ins/014p0000001n00000...
Hope that helps,
Wayne
EDIT:
Something I forgot to mention - what if you had multiple graphs?
This line in the code accommodates a single layer's graph:
lyr = arcpy.mapping.ListLayers(mxd, 'tempsStation', df)[0]
So if you had multiple graphs by various sources (within the same data frame) you could still use ListLayers, then loop on the designated layers to run the selection command. If in different dataframes, then you'd likely have a nested loop- a loop running on the layers inside a loop running on the specific data frames (return on ListDataFrames).