- Home
- :
- All Communities
- :
- Developers
- :
- Python
- :
- Python Questions
- :
- How to merge this two layer
- Subscribe to RSS Feed
- Mark Topic as New
- Mark Topic as Read
- Float this Topic for Current User
- Bookmark
- Subscribe
- Mute
- Printer Friendly Page
How to merge this two layer
- Mark as New
- Bookmark
- Subscribe
- Mute
- Subscribe to RSS Feed
- Permalink
I have made an map where I can see respone times for the fire truck, I did it in service area of network analysis, and made one for helicopter with buffer tool. In the attribute table have i add field like minutes, speed and distance.
My problem now is how I should do to merge this to layer to one where I can see if the helicopter or the fire truck is fastest to each pixel. I want it in a layer there it shows in two diffrent color.
Or is there another way I should have done the last maps to create this map.
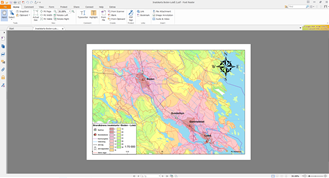
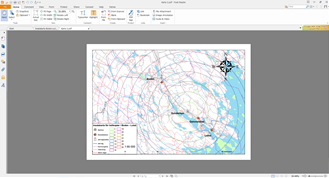
Hope someone understands what I mean and can help me 
/ Lina
- Mark as New
- Bookmark
- Subscribe
- Mute
- Subscribe to RSS Feed
- Permalink
Do you have two data frames? one with the desired service area and one without? If so, simply move or copy the layer into the desired dataframe. Or perform the analysis in the right data frame. If is confusing since you are showing layouts and it is the contents of the data frames that is of more importance
- Mark as New
- Bookmark
- Subscribe
- Mute
- Subscribe to RSS Feed
- Permalink
There are two maps created in the same file, but consists of two different layers. If I make these to raster with polygon to raster tool so I can see in each of these two layers how long time it takes to travel to each specific pixel. Now I'll need to create one commonly layer of these two which shows in each pixel if the fire truck or helicopter is the fastest. I can Not have this layer on top of each in the table of contents. I guess I can use the tool, raster calculator? but do not know what formula to write to get it to appear like this. I think something like if the fire engine is the fastest so, 0 , if helikoterns is fastest so 1. So I can in this new layer see only in these two colors, which is fastest to each specific pixel.
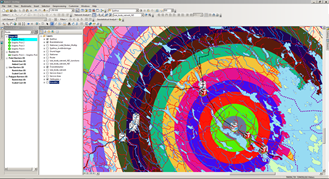

Here is the raster layers, that I want to in only one layer and show the fastest. Each color is for every 2 minutes up to 30 minutes. They are in the same cell size.
- Mark as New
- Bookmark
- Subscribe
- Mute
- Subscribe to RSS Feed
- Permalink
You could use this tool (Cell statistics) to create an raster of the expected response time of the services combined.
then I think you could use this tool (Con), to say (Not 100% sure about the specifics of this bit but from reading help it looks like it may be possible):
If JourneyTime Combined = JourneyTime Helicopter --> This is an helicopter area, else it is an fireengine area.
Extra Info!: ArcGIS Desktop ArcGIS Desktop
Thinking about areas where values are the same....Maybe you would do it the other way, as its probably cheaper to send a fire engine!
If JourneyTimeCombined = JourneyTime FireEngine --> This is an Fireengine area, else it is an helicopter area.
- Mark as New
- Bookmark
- Subscribe
- Mute
- Subscribe to RSS Feed
- Permalink
No need to convert to a raster to do what you are trying to do:
On one or the other of your feature classes, add a field called "HelicopterMinutes" or "TruckMinutes" and calculate it to the value of the minutes field (assuming the fields are named identically now; this will help you keep track of which time field came from which layer later.)
Use the Union command to merge the two feature classes. This will create a new polygon for every unique area of overlap between polygons in the two layers, and will also keep any areas that don't overlap. The output feature class will have both of your minutes fields in it.
Now add a field to indicate which vehicle is fastest to each polygon, as you described above. You can do this with a simple Python script, or just select for "HelicopterMinutes < TruckMinutes", then calculate the field value to 0 or 1, then repeat with "TruckMinutes < HelicopterMinutes" (or just reverse the selection on the layer).
Then symbolize based on the new field.