- Home
- :
- All Communities
- :
- Developers
- :
- Python
- :
- Python Questions
- :
- How to calculate the average pixel value for each ...
- Subscribe to RSS Feed
- Mark Topic as New
- Mark Topic as Read
- Float this Topic for Current User
- Bookmark
- Subscribe
- Mute
- Printer Friendly Page
How to calculate the average pixel value for each band across multiple raster layers?
- Mark as New
- Bookmark
- Subscribe
- Mute
- Subscribe to RSS Feed
- Permalink
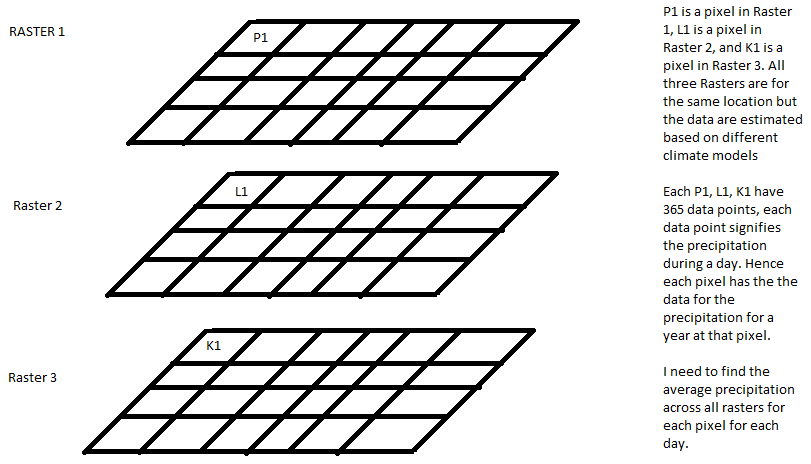
I have 20 netcdf files that are essentially data sets of daily precipitation across a region. Each netcdf file is the output of one climate models. Hence each pixel in a netcdf file has 365 bands that represent the precipitation value for each day. I want to calculate the precipitation for each pixel for each day averaged across all the climate models.
I tried converting the raster to point files and extracting multiple values to the point, extracting the data to excel and then averaging them for each raster. I was wondering if there is a more efficient way to do this either using arcpy or model builder.
Suggestions and help would be appreciated!
- Mark as New
- Bookmark
- Subscribe
- Mute
- Subscribe to RSS Feed
- Permalink
Yes, the Cell Statistics tool is the way to do it if you don't want to convert your rasters to numpy arrays.
- Mark as New
- Bookmark
- Subscribe
- Mute
- Subscribe to RSS Feed
- Permalink
And have the Spatial Analyst extension or the Image analyst (Pro)
http://pro.arcgis.com/en/pro-app/help/data/imagery/multidimensional-raster-types.htm
- Mark as New
- Bookmark
- Subscribe
- Mute
- Subscribe to RSS Feed
- Permalink
So you have 20 climate models, each climate model is a netcdf file with 365 bands and the result should be a netcdf file with 365 bands where each pixel represents the average value of the 20 models for each day?
Also have a look at Accessing Multidimensional Scientific Data using Python | ArcGIS Blog
Cell statistics as Curtis suggest would be an easy way to calculate the average of the models, but it would require 365 of them and some custom conversion if you need the output in a netdcf file with 365 bands.
- Mark as New
- Bookmark
- Subscribe
- Mute
- Subscribe to RSS Feed
- Permalink
Dan Patterson Xander Bakker@curtis Thanks for the tips..... The logic i am thinking of with regards to either a numpy array or cell statistics is a for loop.
With Numpy:
Convert netcdf to numpy array (matrix) by extracting the id's and then the precipitation values.
Sum up all the 20 arrays and divide all elements by 20 to get average (the id would remain the same since (3+3+3)/3 = 3)
Convert back to netcdf.
With Cell Statistics in arcpy:
Create list of netcdf files from location L - [a.nc b.nc c.nc .....]
array band index B - [ b1 b2 b3 b4 .... b365]
for i in B
for j in L
x=x+l.prday(i)
end j
y = x./20
newnetCDF.column(i) = y
end i
Save newnetcdf
Does this logic make sense? Also i am not proficient with arcpy, so any help and pointers in building this code would be appreciated.
Thanks again for your time!
- Mark as New
- Bookmark
- Subscribe
- Mute
- Subscribe to RSS Feed
- Permalink
Cell statistics is much easier, just generate a list of paths in a python list and pass it to the Cell Statistics tool. The output is a raster with the statistic, cell by cell, that you ask for (ie sum, mean, etc). I think it will fail with 365 inputs though, so you you may have to SUM groups of them, then add the group sums and divide by N using the Raster Calculator tool to get the cell by cell mean of 365 days.
Are you sure the averaged data isn't available somewhere? Some data services do such calculations for you on the fly on the server side, for example USGS GeoData Portal.
- Mark as New
- Bookmark
- Subscribe
- Mute
- Subscribe to RSS Feed
- Permalink
Thank you! That makes sense.
Yes I do not have access to summarized statistics. I am trying to use the climate data from the REACCH dataset and only this dataset is accepted onto the software (cropsyst) I am trying to simulate in.
- Mark as New
- Bookmark
- Subscribe
- Mute
- Subscribe to RSS Feed
- Permalink
The logic is described here
Array shape for a month = (31, 100, 100)
a = np.random.randint(1, 10, size=(31, 100, 100))
a
Out[7]:
array([[[5, 9, ..., 2, 2],
[4, 1, ..., 6, 7],
...,
[3, 9, ..., 4, 1],
[6, 8, ..., 5, 8]],
[[1, 2, ..., 2, 4],
[3, 7, ..., 5, 9],
...,
[3, 4, ..., 7, 9],
[9, 9, ..., 1, 5]],
...,
[[6, 9, ..., 3, 1],
[4, 8, ..., 4, 6],
...,
[8, 1, ..., 5, 7],
[9, 5, ..., 9, 1]],
[[9, 9, ..., 2, 4],
[8, 6, ..., 1, 1],
...,
[6, 7, ..., 1, 5],
[8, 3, ..., 8, 9]]])
np.mean(a, axis=0)
Out[8]:
array([[ 5.13, 5.94, ..., 4.48, 3.94],
[ 5.68, 4.87, ..., 4.81, 5.48],
...,
[ 5.42, 4.97, ..., 5.32, 5.13],
[ 5.58, 5.06, ..., 5.29, 5.48]])
How big is your array???
np.mean(a0, 0)
Out[11]:
array([[ 4.81, 5.52, ..., 5.42, 5.1 ],
[ 5.03, 4.29, ..., 4.65, 5.1 ],
...,
[ 4.97, 5.32, ..., 4.97, 5.29],
[ 4.58, 5.48, ..., 5.58, 5.26]])
%timeit np.mean(a0, 0)
76.9 ms ± 2.11 ms per loop (mean ± std. dev. of 7 runs, 10 loops each)
a1 = np.random.randint(1, 10, size=(31, 2500, 2000))
np.mean(a1, 0)
Out[14]:
array([[ 4.68, 4.35, ..., 6.16, 4.26],
[ 4.84, 5.06, ..., 5.06, 4.97],
...,
[ 4.87, 5.16, ..., 4.52, 5.23],
[ 4.35, 5.35, ..., 4.58, 4.68]])
A year's worth?
a0.shape
Out[15]: (31, 1250, 1000)
months = [a0 + i for i in range(12)]
years = np.array(months)
years.shape
Out[18]: (12, 31, 1250, 1000)
np.mean(years, axis=(0,1))
Out[19]:
array([[ 10.31, 11.02, ..., 10.92, 10.6 ],
[ 10.53, 9.79, ..., 10.15, 10.6 ],
...,
[ 10.47, 10.82, ..., 10.47, 10.79],
[ 10.08, 10.98, ..., 11.08, 10.76]])
np.mean(years, axis=(0,1)).shape
Out[20]: (1250, 1000)
Yes but I have nodata values... simple, use np.nanmean
numpy is extremely simple and flexible. *.npy, *.npz file formats are the native numpy data formats and can be derived from the hdf5, netcdf brethern
- Mark as New
- Bookmark
- Subscribe
- Mute
- Subscribe to RSS Feed
- Permalink
So my array for each raster is 3-dimensional. So each raster is 365X142X144. An i have 20 models with the same array size.
Do i just transform all my netCDF files to raster and then raster to numpy array? Also doesnt numpy change the precision of the numbers in the original dataset. All my precipitaion values are in float and numpy would change it to int would it not? There are additional components like the spatial location of the bloacks, how do i relate the new averaged values back to the location and then write it out to another netcdf file?