- Home
- :
- All Communities
- :
- Developers
- :
- Python
- :
- Python Questions
- :
- How to calculate the average pixel value for each ...
- Subscribe to RSS Feed
- Mark Topic as New
- Mark Topic as Read
- Float this Topic for Current User
- Bookmark
- Subscribe
- Mute
- Printer Friendly Page
How to calculate the average pixel value for each band across multiple raster layers?
- Mark as New
- Bookmark
- Subscribe
- Mute
- Subscribe to RSS Feed
- Permalink
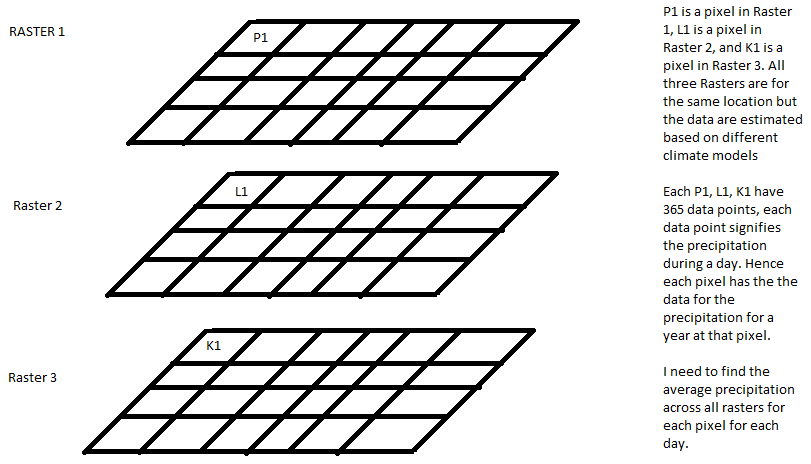
I have 20 netcdf files that are essentially data sets of daily precipitation across a region. Each netcdf file is the output of one climate models. Hence each pixel in a netcdf file has 365 bands that represent the precipitation value for each day. I want to calculate the precipitation for each pixel for each day averaged across all the climate models.
I tried converting the raster to point files and extracting multiple values to the point, extracting the data to excel and then averaging them for each raster. I was wondering if there is a more efficient way to do this either using arcpy or model builder.
Suggestions and help would be appreciated!
- Mark as New
- Bookmark
- Subscribe
- Mute
- Subscribe to RSS Feed
- Permalink
My examples were just using integers.
Numpy works quite comfortably with floats.
There are several ways to get the raster to array format. (see scipy for builtins, hdf5 etc
If you have a need to map the result, arcpy.da.NumPyArrayToRaster only requires the 2D raster and a point object denoting the bottom left corner.
The Anaconda distribution of python has pretty well everything you need
- « Previous
-
- 1
- 2
- Next »
- « Previous
-
- 1
- 2
- Next »