- Home
- :
- All Communities
- :
- Developers
- :
- Python
- :
- Python Questions
- :
- Re: Find values and Interpolate recurrence Interva...
- Subscribe to RSS Feed
- Mark Topic as New
- Mark Topic as Read
- Float this Topic for Current User
- Bookmark
- Subscribe
- Mute
- Printer Friendly Page
Find values and Interpolate recurrence Interval
- Mark as New
- Bookmark
- Subscribe
- Mute
- Subscribe to RSS Feed
- Permalink
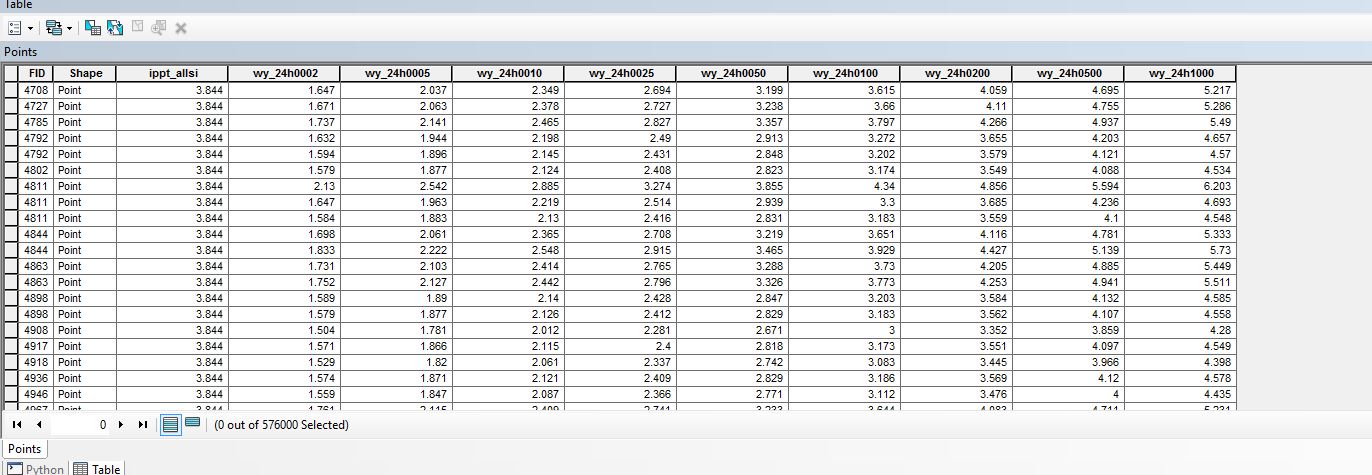
In the table on the Image below, ippt_allsi represents precipitation amounts for a given storm. The rest of the fields represent the precipitation amounts for that number of years recurrence intervals. 2, 5,10, 25, 50 and so on. I need a script that will take the precipitation amount for the storm, (appt_allsi) then find the bounding larger and smaller values and interpolate the recurrence year by where the precipitation amount falls between those years values. For instance, for the first record, 3.84 inches of rain fell. The 100 year amount is 3.615 and the 200 year amount is 4.059. How would I return the interpolated recurrence year for the 3.84 inches? I am fairly new to python and am struggling. Could somebody please get me started in the right direction?
Solved! Go to Solution.
- Mark as New
- Bookmark
- Subscribe
- Mute
- Subscribe to RSS Feed
- Permalink
As an alternative to numpy*, you can do something like this in the field calculator or using an update cursor. This is only lightly tested, and I'm sure you'll find some gotchas along the way.
Code block- Python parser:
def myFunc(amt, f2, f5, f10, f100, f1000):
  vals = [f2, f5, f10, f100, f1000] # hardcoded
  years = [2, 5, 10, 100, 1000] # hardcoded
  for i in range(len(vals)): # loop through potential values
    if amt < vals: # check if the amount is less than the currently evaluated field
      low_yr = years # small year in range
      high_yr = years[i+1] # large year in range
      low_val = vals # low value in range
      high_val = vals[i+1] # high value in range
      prop = (amt-low_val)/(high_val - low_val) # proportional amount in range
      recur = (prop * (high_yr - low_yr)) + low_yr # proportional year in range
      return recur # return the recurrence year
      break # stop evaluating other fields
Expression:
myFunc( !appt_allsi!, !wy_24h0002!, !wy_24h0005!, !wy_24h0010!, !wy_24h0100!, !wy_24h1000! )
*learning numpy for a one-off is cruel and unusual punishment, IMO.
- Mark as New
- Bookmark
- Subscribe
- Mute
- Subscribe to RSS Feed
- Permalink
Verbose demo with constructed featureclass... only 5 records, number isn't relevent, can create output directly.
# coding: utf-8
"""
Script:  interpolate_demo.py
Author:  [email protected]
Purpose: To demonstrate interpolation using values in ndarrays

field names constructed using the following to simplify dt
  dt_names = ["v"+str(i) for i in range(N)]
  dt = [(dt_names, "<f8") for i in range(N)]
Array should be constructed using arcpy.da.FeaturelassToNumPyArray
RI - time relationships are on a row by row basis, could be greatly
simplified if there were fewer, but not needed

"""
import numpy as np
np.set_printoptions(edgeitems=3,linewidth=80,precision=2,suppress=True,
                    threshold=20, formatter={'float': '{: 0.3f}'.format})

# fix dtype
dt = [('OIDName', '<i4'), ('Shape', '<f8', (2,)), ('obs', '<f8'),
      ('v0', '<f8'), ('v1', '<f8'), ('v2', '<f8'), ('v3', '<f8'),
      ('v4', '<f8'), ('v5', '<f8'), ('v6', '<f8'), ('v7', '<f8')]
a = np.array([(0, [0,0],  7.5, 1, 3, 5, 10, 20, 50, 100, 200),
              (1, [1,2], 15.0, 1, 3, 5, 10, 20, 50, 100, 200),
              (2, [3,4], 75.0, 1, 3, 5, 10, 20, 50, 100, 200),
              (3, [5,6], 35.0, 2, 4, 6, 11, 25, 50, 140, 225),
              (4, [7,8],  9.0, 3, 5, 7, 10, 22, 40, 120, 230)], dtype=dt)
# ---- It begins below
t = [5,10,20,50,100,200,500,1000]  # fixed time increments
obs = a["obs"]                    # we know the name so use it
ri_names = list(a.dtype.names[3:]) # could type in a long list
RI_s = a[ri_names]                # RI curve values
N = len(obs)                      # number of records
# -- the magic of list comprehensions, could vectorize, but hey...
result = [ (a["OIDName"], a["Shape"].tolist(), obs,
            np.interp(obs, RI_s.tolist(), t) )
            for i in range(N)]
dt_out =  [('OIDName', '<i4'), ('Shape', '<f8', (2,)),
          ('obs', '<f8'),  ('RI_2', '<f8')]
out_array = np.array(result, dtype=dt_out)
# Could send out_array to a featureclass using NumPyArrayToFeatureClass
#---- The rest is fluff
print("\nInput ndarray \n{}\ndtype {}\nShape {}\n".format(a, a.dtype, a.shape))
print("\nViewed differently\n{}".format(a.reshape((-1,1))))
print("\nResults...\nTimes {}\n{}".format(t,out_array.reshape((-1,1))))
#
Outputs
Input ndarray
[(0, [0.0, 0.0], 7.5, 1.0, 3.0, 5.0, 10.0, 20.0, 50.0, 100.0, 200.0)
 (1, [1.0, 2.0], 15.0, 1.0, 3.0, 5.0, 10.0, 20.0, 50.0, 100.0, 200.0)
 (2, [3.0, 4.0], 75.0, 1.0, 3.0, 5.0, 10.0, 20.0, 50.0, 100.0, 200.0)
 (3, [5.0, 6.0], 35.0, 2.0, 4.0, 6.0, 11.0, 25.0, 50.0, 140.0, 225.0)
 (4, [7.0, 8.0], 9.0, 3.0, 5.0, 7.0, 10.0, 22.0, 40.0, 120.0, 230.0)]
dtype [('OIDName', '<i4'), ('Shape', '<f8', (2,)), ('obs', '<f8'),
           ('v0', '<f8'), ('v1', '<f8'), ('v2', '<f8'), ('v3', '<f8'), ('v4', '<f8'),
          ('v5', '<f8'), ('v6', '<f8'), ('v7', '<f8')]
Shape (5,)

Viewed differently
[[(0, [0.0, 0.0], 7.5, 1.0, 3.0, 5.0, 10.0, 20.0, 50.0, 100.0, 200.0)]
 [(1, [1.0, 2.0], 15.0, 1.0, 3.0, 5.0, 10.0, 20.0, 50.0, 100.0, 200.0)]
 [(2, [3.0, 4.0], 75.0, 1.0, 3.0, 5.0, 10.0, 20.0, 50.0, 100.0, 200.0)]
 [(3, [5.0, 6.0], 35.0, 2.0, 4.0, 6.0, 11.0, 25.0, 50.0, 140.0, 225.0)]
 [(4, [7.0, 8.0], 9.0, 3.0, 5.0, 7.0, 10.0, 22.0, 40.0, 120.0, 230.0)]]

Results...
Times [5, 10, 20, 50, 100, 200, 500, 1000]
[[(0, [0.0, 0.0], 7.5, 35.0)]
 [(1, [1.0, 2.0], 15.0, 75.0)]
 [(2, [3.0, 4.0], 75.0, 350.0)]
 [(3, [5.0, 6.0], 35.0, 140.0)]
 [(4, [7.0, 8.0], 9.0, 40.0)]]
Values against average RI data
# averages
RI_avg = np.mean(RI_s.tolist(),axis=0)
t = [5,10,20,50,100,200,500,1000]  # fixed time increments as before
obs = a["obs"]   # as before
result2 = np.interp(obs, RI_avg.tolist(), t)
>>> result2
array([ 32.391, 71.429, 326.562, 151.128, 42.174])
Plus other combinations if needed
- Mark as New
- Bookmark
- Subscribe
- Mute
- Subscribe to RSS Feed
- Permalink
Thanks again Dan! Your example was exactly what I needed. Very helpful!
- « Previous
-
- 1
- 2
- Next »
- « Previous
-
- 1
- 2
- Next »