- Home
- :
- All Communities
- :
- Developers
- :
- Python
- :
- Python Questions
- :
- Excel SUMIFs using Python
- Subscribe to RSS Feed
- Mark Topic as New
- Mark Topic as Read
- Float this Topic for Current User
- Bookmark
- Subscribe
- Mute
- Printer Friendly Page
Excel SUMIFs using Python
- Mark as New
- Bookmark
- Subscribe
- Mute
- Subscribe to RSS Feed
- Permalink
Currently I'm using SUMIFs in Excel to calculate some values in a spreadsheet and then having to make the updates manually in my attribute tables or reloading all of my data into the feature class. Is there a way to do SUMIFs using Python in ArcMap? One method I came up with was using Summary Statistics. For my current workflow, I'd need to do it three different times and then either join the tables or use cursors to populate the information.
I need to get the sum of a field based on the address for another field's values. Another calculation is a max value based on address for another field, and then lastly need a count for an address for another field.
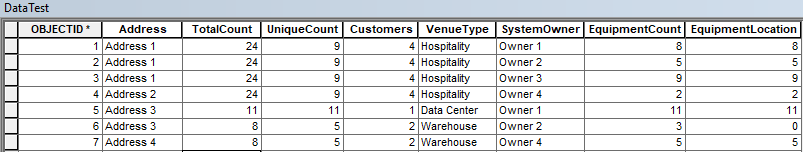
My original thought process was to create a basic python tool using arcpy.Statistics_analysis (Summary Statistics) where my sum fields would be [[EquipmentCount, SUM], [EquipmentLocation, MAX], [Address, COUNT]] and my case field would be Address. The output would ideally be In Memory where I can use search cursor to build a dictionary where Address is my Key and the rest of the values would be the values. Using Update Cursor, I would populate the TotalCount field (using value of EquipmentCount - SUM), UniqueCount field (using EquipmentLocation - MAX), and Cutomers field (using Address - COUNT).
However I am trying to find another way to do this without having to go down the summary statistics route. I was hoping to use Field Calculator if possible or another alternative. I do not have any experience using the Pro-Logic in Field Calculators or numpy for that matter.
- Mark as New
- Bookmark
- Subscribe
- Mute
- Subscribe to RSS Feed
- Permalink
Providing either sample or example data will allow commenters to give sample code in addition to workflow suggestions.
When you are finding the sum, max, and count for this address field; how are you storing the results? Will the results be in a separate table with a single record for each address, or do you want to populate several records in the existing table with the same sum, max, and count values?
- Mark as New
- Bookmark
- Subscribe
- Mute
- Subscribe to RSS Feed
- Permalink
Hi Joshua, I've updated my post with a screenshot of the table I have for testing.
- Mark as New
- Bookmark
- Subscribe
- Mute
- Subscribe to RSS Feed
- Permalink
yes, but you would have to get the data out to an appropriate format, but this demonstrates the principle
import numpy as np
names = np.asarray(['jim', 'sam', 'bill', 'sam'])
values = np.asarray([1, 2, 6, 5])
result = {name: values[names == name].sum() for name in np.unique(names)}
result
{'bill': 6, 'jim': 1, 'sam': 7}Where
'names' : is basically a column in a table
'values' : is another column with the values you want to summarize
'result' : in this case it is dictionary created by (a) getting the unique names in the names column, then for the values
column, it finds the matching entries for a particular name, then sums the value (in this example). The dictionary is constructed from it but you could make a list and or array from it then create a table.
This missive was derived directly from the first hit on 'python sumif' in my browser
arrays - What is the Python list or NumPy equivalent of Excel's SUMIF function? - Stack Overflow
there are loads more.
What format are your data? 2 columns? then it is simple... Do you just want a summary table? ditto
Any more details and/or data?
- Mark as New
- Bookmark
- Subscribe
- Mute
- Subscribe to RSS Feed
- Permalink
Hi Dan, I've updated my post with a view of my table that I am using for testing with some further steps as to what I had in mind. My current method I can script out using python but I was hoping to find a faster method if possible.
I will try your way out in the mean time. Thank you!
- Mark as New
- Bookmark
- Subscribe
- Mute
- Subscribe to RSS Feed
- Permalink
TableToNumPyArray—Data Access module | ArcGIS Desktop
NumPyArrayToTable—Data Access module | ArcGIS Desktop
# ---- some examples ---- see my blog for lots more
a = arcpy.da.TableToNumPyArray(in_fc, "*", skip_nulls=True)
a.dtype.names
('OBJECTID', 'Shape', 'Id', 'Long_1', 'Short_1', 'Float_1', 'Double_1', 'Text_1',
'DT_str', 'Shape_Length', 'Shape_Area')
a0 = a[['Long_1', 'Double_1', 'Text_1']]
a0
array([(1, 100., 'A 10 chars'), (3, 300., 'C not null')],
dtype={'names':['Long_1','Double_1','Text_1'], 'formats':['<i4','<f8','<U10'],
'offsets':[24,36,44], 'itemsize':180})
np.sum(a0['Long_1']) # ---- some stats
4
np.min(a0['Double_1']) # ---- some stats
100.0
q = np.where(a0['Double_1'] > 200) # ---- a little query
a0[q] # ---- pull out the answer
array([(3, 300., 'C not null')],
dtype={'names':['Long_1','Double_1','Text_1'], 'formats':['<i4','<f8','<U10'], 'offsets':[24,36,44], 'itemsize':180})
# ---- and onward# ---- instead of slicing use 'dot' notation by viewing the data as a record array
ar = a.view(np.recarray)
ar.Shape # ---- pull up the geometry
array([[ 300005. , 5000005. ],
[ 300020. , 5000010.22]])
ar.Long_1 # ---- ditto for another field
array([1, 3])
ar.DT_str # ---- ditto, ditto
array(['2019/03/28 00:00:00', '2019/03/30 00:00:00'], dtype='<U20')