- Home
- :
- All Communities
- :
- Developers
- :
- Python
- :
- Python Questions
- :
- Re: ESRI GRID file (ASC)
- Subscribe to RSS Feed
- Mark Topic as New
- Mark Topic as Read
- Float this Topic for Current User
- Bookmark
- Subscribe
- Mute
- Printer Friendly Page
- Mark as New
- Bookmark
- Subscribe
- Mute
- Subscribe to RSS Feed
- Permalink
How to create an empty ESRI GRID file (ASC) based on the size of "Based polygon" with cell size 10?
Solved! Go to Solution.
Accepted Solutions
- Mark as New
- Bookmark
- Subscribe
- Mute
- Subscribe to RSS Feed
- Permalink
I'm a little confused exactly what you're after here. ESRI GRID (raster) and ASCII (text) are two separate file formats.
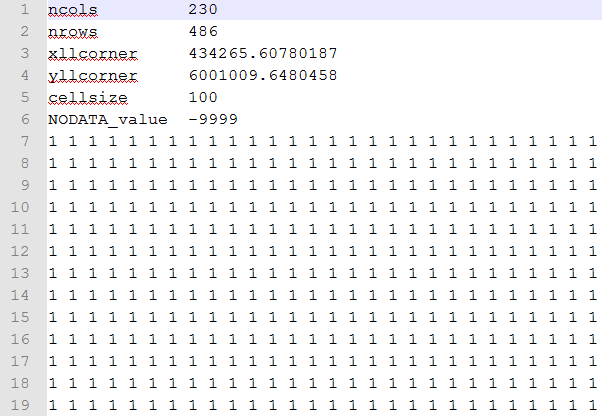
You could create an ASCII file as easily as opening a text editor and start typing a file like the following, substituting your own values in the header and use the 'NODATA' value for the pixel values:
- Mark as New
- Bookmark
- Subscribe
- Mute
- Subscribe to RSS Feed
- Permalink
is the conversion to raster toolset
the perhaps raster to ASCII https://desktop.arcgis.com/en/arcmap/latest/tools/conversion-toolbox/raster-to-ascii.htm
By an 'empty' one... do you mean one where the bounds are classed as no data, it is not clear what you are trying to accomplish
- Mark as New
- Bookmark
- Subscribe
- Mute
- Subscribe to RSS Feed
- Permalink
Thanks for comment, empty I mean is new Grid and it can be with no data.
- Mark as New
- Bookmark
- Subscribe
- Mute
- Subscribe to RSS Feed
- Permalink
I'm a little confused exactly what you're after here. ESRI GRID (raster) and ASCII (text) are two separate file formats.
You could create an ASCII file as easily as opening a text editor and start typing a file like the following, substituting your own values in the header and use the 'NODATA' value for the pixel values:
- Mark as New
- Bookmark
- Subscribe
- Mute
- Subscribe to RSS Feed
- Permalink
well you could exploit Darren's data and simply convert the nodata value to 1, then use the
ASCII to Raster—Help | ArcGIS for Desktop . You will obviously have to have the correct number of rows and columns and properly specify the location of the bottom left cell (center or corner) and the X and Y cell size (ie 10m for both)
You can cheat even further by using the ideas here.
NumPyArrayToRaster—Help | ArcGIS for Desktop
import numpy as np
import arcpy
LLcorner = arcpy.Point(500000,5000000) # x,y coordinate of the lower left corner, in this case the middle of a UTM zone
rows= 10
cols = 10
cell_size = 10
nodata = 0.0 # or whatever
a = np.zeros((rows,cols),dtype='float64') # or 'int32'
out_raster = arcpy.NumPyArrayToRaster( a, LLcorner, x_cell_size = cell_size, value_to_nodata = nodata)
out_raster.save(" path and name to raster) # specify and extension for non-esri grid formats such as tif
- Mark as New
- Bookmark
- Subscribe
- Mute
- Subscribe to RSS Feed
- Permalink
Thanks all for that. Now the step 2 I wish to achieve is below:
Step 2
Once the ASC file in #1 above is created, I need to run the following formula on each of the grid cell.
First:
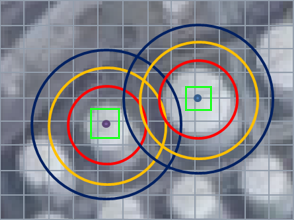
With reference from the point of interest, as shown in the "Based polygon" image below (with green square),
I want to run tan-1 (x/y)
(Grid point (x,y) will be in the center of each cell)
For Example:
Location of point of interest (0, 0)
tan-1 of (75, 50) = 56.3 (value of one of the grid cell with reference from point of interest (0,0))
[If point of interest is 10, 10 in the map, then the X,Y calculated above will be 85, 60 in the map]
Second:
I need to calculate linear interpolation (which is not yet confirmed the formula)
Third:
Result A x Result B x [Some other value]
I am trying to figure out if there is other way to do, but thanks all in advance for reply.