- Home
- :
- All Communities
- :
- Developers
- :
- Python
- :
- Python Questions
- :
- Re: Count the percentage of positive and Negative ...
- Subscribe to RSS Feed
- Mark Topic as New
- Mark Topic as Read
- Float this Topic for Current User
- Bookmark
- Subscribe
- Mute
- Printer Friendly Page
Count the percentage of positive and Negative pixel within the zone.
- Mark as New
- Bookmark
- Subscribe
- Mute
- Subscribe to RSS Feed
- Permalink
Hi All,
I have a raster which contains value range from -20 to +20. I am trying to calculate the zone wise percentage of negative and positive pixel count within the zone.
Somewhere I read TABULAR option can work, but it supported only the Vector data and Zonal statistics also can't that.
So how to calculate the percentage of pixel count with in the zone. I have zone's shape file.
Solved! Go to Solution.
- Mark as New
- Bookmark
- Subscribe
- Mute
- Subscribe to RSS Feed
- Permalink
Hi jayanta.poddar, Thanks. I tried the same, but still same error. i think problem with Name of zone field in feature class.
- Mark as New
- Bookmark
- Subscribe
- Mute
- Subscribe to RSS Feed
- Permalink
Can you indicate what the exact error message is and on which line the error occurs? Apart from the missing 'r' (raw) in the path, I don't see what could be the problem.
Does the path "D:\Raster_Statistics\Count_Pixel" exist and does the script has write access to that location? Does a gdb with the output name already exist at that location?
You are also setting your workspace to the folder and not the gdb. Is there a specific reason for that?
- Mark as New
- Bookmark
- Subscribe
- Mute
- Subscribe to RSS Feed
- Permalink
Hi Xander Bakker, thanks.
I am mentioning below the input path which I am using and error message also. I tried both with gdb and without gdb in the input path but the error message is same.
However, I have attached my input file both raster and Zone vector file with the previous thread. location Just after the script which you posted.
Input path name:
import numpy as np
zones_ras = r'D:\Raster_Statistics\Count_Pixel\Zones'
values_ras = r'D:\Raster_Statistics\Count_Pixel\NPP'
Error massage:
load modules...
create numpy rasters...
Traceback (most recent call last):
File "<module1>", line 70, in <module>
File "<module1>", line 12, in main
File "C:\Program Files\ArcGIS\Desktop10.3\ArcPy\arcpy\__init__.py", line 2244, in RasterToNumPyArray
return _RasterToNumPyArray(*args, **kwargs)
RuntimeError: ERROR 000732: Input Raster: Dataset D:\Raster_Statistics\Count_Pi
- Mark as New
- Bookmark
- Subscribe
- Mute
- Subscribe to RSS Feed
- Permalink
change the filename and saving location to something like..
r"D:\gis\cnt\x
Whenever you are getting filename errors something is amiss. and given your input raster's name is truncated halfway through a folder name, then it is time to quit trying the same thing, move the raster to a new folder and give it a new name... then try again... if it works, then it was something about the filename, if not... then it is something else.
- Mark as New
- Bookmark
- Subscribe
- Mute
- Subscribe to RSS Feed
- Permalink
I noticed something strange in the data that you attached:
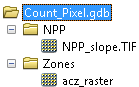
The folder Count_Pixel.gdb is a folder and not a File Geodatabase as I suspected. The folder contains two subfolders, one with a TIF for the NPP slope values and another with an Esri Grid file with the rasterized zones.
To avoid confusion I placed them in a separate folder and adjusted the code to run with the data. See code below:
#-------------------------------------------------------------------------------
# Name: count_pos_neg_pixels.py
# Purpose:
#
# Author: Xander
#
# Created: 06-08-2017
#-------------------------------------------------------------------------------
def main():
print "load modules..."
import arcpy
import numpy as np
arcpy.env.overwriteOutput = True
values_ras = r'C:\GeoNet\CountPixels\NPP_slope.TIF'
zones_ras = r'C:\GeoNet\CountPixels\acz_raster'
nodata = -3.4028235e+38
print "create numpy rasters..."
np_zones = arcpy.RasterToNumPyArray(zones_ras)
np_values = arcpy.RasterToNumPyArray(values_ras)
print "read props numpy raster..."
rows = np_zones.shape[0]
cols = np_zones.shape[1]
print " - rows:", rows
print " - cols:", cols
print "loop through pixels..."
pix_cnt = 0
dct = {}
for row in range(rows):
for col in range(cols):
pix_cnt += 1
if pix_cnt % 5000 == 0:
print " - row:", row, " col:", col, " pixel:", pix_cnt
zone = np_zones[row, col]
value = np_values[row, col]
if zone > 1:
if zone in dct:
stats = dct[zone]
stats = UpdateStats(stats, value, nodata)
else:
stats = CreateStats(value, nodata)
dct[zone] = stats
print "\nZone\tsum\tcnt\tmean\tmin\tmax\tcnt_neg\tcnt_pos\tcnt_nodata"
for zone, stats in sorted(dct.items()):
print zone, '\t', '\t'.join(str(a).replace('.', ',') for a in stats)
def UpdateStats(stats, value, nodata):
# sum, cnt, mean, min, max, cnt_neg, cnt_pos, cnt_nodata
if value > nodata / 2.0:
stats[0] += value
stats[1] += 1
stats[2] = float(stats[0]) / float(stats[1])
if value < stats[3]:
stats[3] = value
if value > stats[4]:
stats[4] = value
if value < 0:
stats[5] += 1
if value > 0:
stats[6] += 1
else:
stats[7] += 1
return stats
def CreateStats(value, nodata):
# sum, cnt, mean, min, max, cnt_neg, cnt_pos, cnt_nodata
if value > nodata / 2.0:
return [value, 1, value, value, value, 1 if value < 0 else 0, 1 if value > 0 else 0, 0]
else:
return [0, 0, None, 99999999, -9999999, 0, 0, 1]
if __name__ == '__main__':
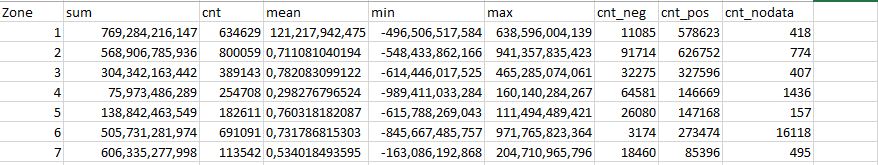
main()The result was loaded into Excel:

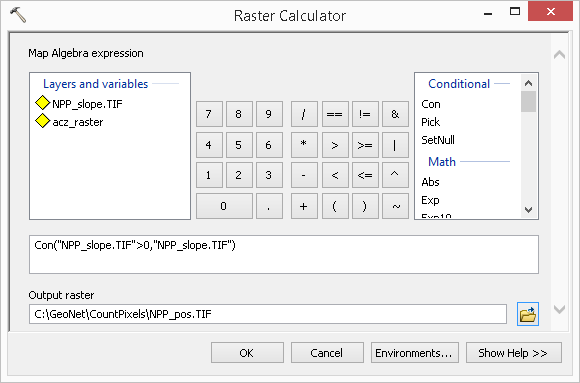
When you do it the way Dan and Jayanta explained, you will create a raster with only the positive values:
Create a raster with only the negative values:

Do a Zonal Statistics as Table on the raster with the positive values: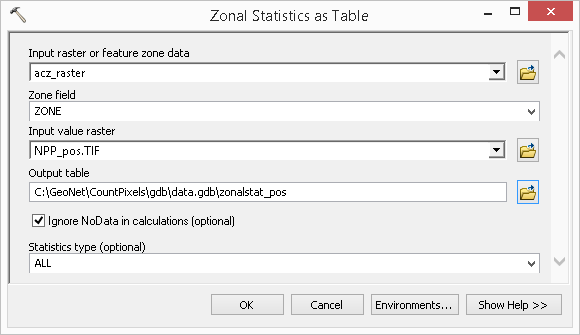
.... and another one on the negative values:

Which will produce this result for the positive values:
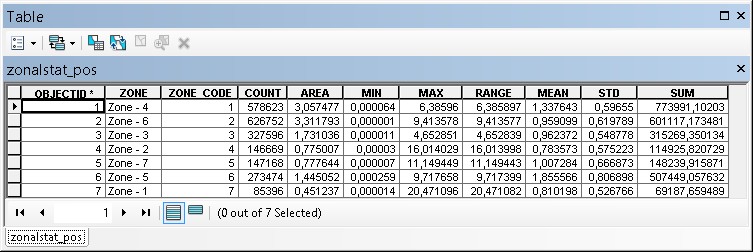
and this one for the negative values:
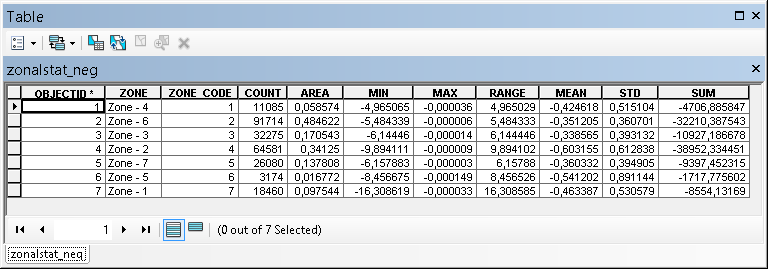
When I compare the count for both methods, they correspond.
- Mark as New
- Bookmark
- Subscribe
- Mute
- Subscribe to RSS Feed
- Permalink
Hi Xander Bakker, Thanks.
I ran the script using same data sets which you used, after running the script I am getting such output which is not matching with your output file which you attached and the Zone column 1 is not appearing. the last column acz_raster also not appearing in my output. I copied the output from PyScripter after running and paste it into Excel.
Below I have attached the output which I received after running the script.
I am running the script on PyScripter and ArcGIS 10.3.
Zone sum cnt mean min max cnt_neg cnt_pos cnt_nodata
2 568906,785936 800059 0,711081040194 -5,48433862166 9,41357835423 91714 626752 774
3 304342,163442 389143 0,782083099122 -6,14446017525 4,65285074061 32275 327596 407
4 75973,486289 254708 0,298276796524 -9,89411033284 16,0140284267 64581 146669 1436
5 138842,463549 182611 0,760318182087 -6,15788269043 11,1494489421 26080 147168 157
6 505731,281974 691091 0,731786815303 -8,45667485757 9,71765823364 3174 273474 16118
7 60633,5277998 113542 0,534018493595 -16,3086192868 20,4710965796 18460 85396 495
255 10,6494542035 62 0,171765390379 0,0 2,51514136574 0 8 2371928- Mark as New
- Bookmark
- Subscribe
- Mute
- Subscribe to RSS Feed
- Permalink
My bad. Change the code "if zone > 1:" on line 38 into "if zone < 255:".
In my case the Nodata value of the raster is -128 and therefore I should have used "if zone > 0:". However, in your case the nodata value is 255, so you could check for < 255.
- Mark as New
- Bookmark
- Subscribe
- Mute
- Subscribe to RSS Feed
- Permalink
Hi Xander Bakker Yes, now it's appearing perfectly and got exact correct pixel calculation. thanks for such wonderful script and it will save the time and also reduce the chances of human introduce error.
And the last column (acz_raster) did you type it manually into excel, based on the zone sequence in the zone raster or it's automatically come through script?
Because for me it's not appearing. it looks like (below attached) after paste into excel, after "cnt_nodata", there is no other column.
The table which you attached there is complete information. but when i am running not getting the same, is there anything need to change?
Thank you
regards
Shouvik Jha
- Mark as New
- Bookmark
- Subscribe
- Mute
- Subscribe to RSS Feed
- Permalink
Guilty as charged... I did copied and pasted these values in the last field, from the attribute table of the raster. However, see below a small snippet of code to extract the value into a dictionary. You will need the arcpy.SearchCursor since the arcpy.da.SearchCursor does not support attribute tables of rasters datasets.
For instance my example raster has the following fields:
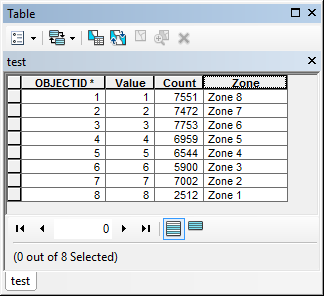
You can use the following code to create a dictionary:
def main():
import arcpy
zones_ras = r'C:\GeoNet\CountPosNegPixels\data2.gdb\test'
fld_value = "Value"
fld_zone = "Zone"
dct = {}
curs = arcpy.SearchCursor(zones_ras)
for row in curs:
value = row.getValue(fld_value)
zone = row.getValue(fld_zone)
dct[value] = zone
for val, zone in dct.items():
print "value {0} corresponds to {1}".format(val, zone)
if __name__ == '__main__':
main()This will print:
value 1 corresponds to Zone 8
value 2 corresponds to Zone 7
value 3 corresponds to Zone 6
value 4 corresponds to Zone 5
value 5 corresponds to Zone 4
value 6 corresponds to Zone 3
value 7 corresponds to Zone 2
value 8 corresponds to Zone 1In the code after creating the dictionary, when you write the result you can convert the raster value back to zone by using dct[value] to get the zone description.
- Mark as New
- Bookmark
- Subscribe
- Mute
- Subscribe to RSS Feed
- Permalink
Hi xander_bakker, thank you very much. The script is very useful to generate statistics from the raster.