- Home
- :
- All Communities
- :
- Developers
- :
- Python
- :
- Python Questions
- :
- Re: Count the percentage of positive and Negative ...
- Subscribe to RSS Feed
- Mark Topic as New
- Mark Topic as Read
- Float this Topic for Current User
- Bookmark
- Subscribe
- Mute
- Printer Friendly Page
Count the percentage of positive and Negative pixel within the zone.
- Mark as New
- Bookmark
- Subscribe
- Mute
- Subscribe to RSS Feed
- Permalink
Hi All,
I have a raster which contains value range from -20 to +20. I am trying to calculate the zone wise percentage of negative and positive pixel count within the zone.
Somewhere I read TABULAR option can work, but it supported only the Vector data and Zonal statistics also can't that.
So how to calculate the percentage of pixel count with in the zone. I have zone's shape file.
Solved! Go to Solution.
Accepted Solutions
- Mark as New
- Bookmark
- Subscribe
- Mute
- Subscribe to RSS Feed
- Permalink
You could use a Con statement and subdivide your raster into values < 0 and > 0
like Con('raster' <= 0, 0, 1) which would result in a raster with values <= 0 being classified as 0 and those > 0 being classified as 1. Then you can use the conventional zonal statistics to get the counts for each class within the zone.
The rest is just conversion to percentage.
- Mark as New
- Bookmark
- Subscribe
- Mute
- Subscribe to RSS Feed
- Permalink
Adding to Dan, after executing the Con Tool, if you don't need the final output as a Raster, you could use Zonal Statistics as Table.
Think Location
- Mark as New
- Bookmark
- Subscribe
- Mute
- Subscribe to RSS Feed
- Permalink
Hi Dan Patterson , Jayanta Poddar, Thanks.
I followed the suggestion given by you and I stuck here, I have attached an image,
I want to count the pixel for Negative and positive classes for each zones. After classification < 0 and >0, I got the 0 and 1 value raster, after that i used Zonal statistics to get the pixel number for each zones. but its shows the total number of pixel in each zones, but I want it to count of the positive and Negative pixel for each zones. 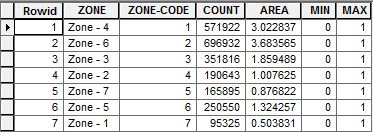
You can see above screenshot, For zone4 shows 571922 numbers of the pixel, but how to get the number of the pixel under to category of positive and negative for each zones.
How to do it .
Thank you
Regards
Shouvik Jha
- Mark as New
- Bookmark
- Subscribe
- Mute
- Subscribe to RSS Feed
- Permalink
Hi Shouvik,
You should have used Con Tool or Set Null (or Raster Calculator) tool.
I will explain the use of Set Null function in Raster Calculator, since Dan has already mentioned the Con tool.
Use the following expressions in Raster Calculator.
1. First, use the following expression to get Raster having all positive or 0 values.
SetNull("Raster1", "Raster1", "VALUE < 0")
2. Then, use the following expression to get Raster having the negative values.
SetNull("Raster1", "Raster1", "VALUE >= 0")
You could use Zonal Statistics (as Table) using the respective Rasters, and append the tables, if desired.
Think Location
- Mark as New
- Bookmark
- Subscribe
- Mute
- Subscribe to RSS Feed
- Permalink
Hi shouvik jha ,
The easiest way would be to follow the instruction provided by Dan Patterson and Jayanta Poddar . You will have two zonas statistics tables as result, one for the positive values and one for the negative values both with the respective count you're after.
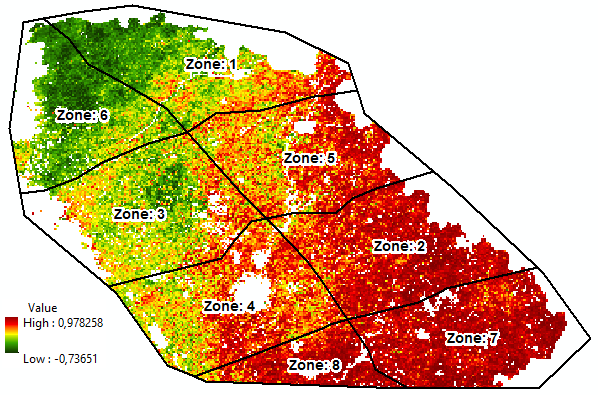
Since in recent occasions we have done some things with using rasters converted to numpy arrays, below the an example of doing it the "hard way". This will only work if both the zone raster and the value raster are aligned (same extent and cell size and coordinate system).
The value raster with the zone:
The resulting statistics:
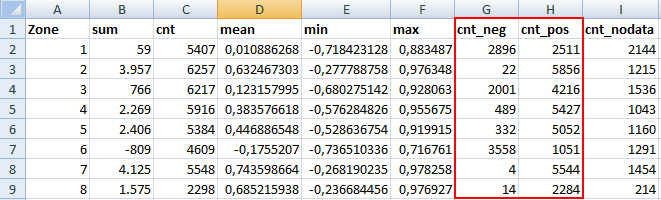
The code used:
#-------------------------------------------------------------------------------
# Name: count_pos_neg_pixels.py
# Purpose:
#
# Author: Xander
#
# Created: 06-08-2017
#-------------------------------------------------------------------------------
def main():
print "load modules..."
import arcpy
arcpy.env.overwriteOutput = True
import numpy as np
zones_ras = r'C:\GeoNet\CountPosNegPixels\data2.gdb\test'
values_ras = r'C:\GeoNet\CountPosNegPixels\data2.gdb\corr'
nodata = -3.4028235e+38
print "create numpy rasters..."
np_zones = arcpy.RasterToNumPyArray(zones_ras)
np_values = arcpy.RasterToNumPyArray(values_ras)
print "read props numpy raster..."
rows = np_zones.shape[0]
cols = np_zones.shape[1]
print " - rows:", rows
print " - cols:", cols
print "loop through pixels..."
pix_cnt = 0
dct = {}
for row in range(rows):
for col in range(cols):
pix_cnt += 1
if pix_cnt % 5000 == 0:
print " - row:", row, " col:", col, " pixel:", pix_cnt
zone = np_zones[row, col]
value = np_values[row, col]
if zone < 255:
if zone in dct:
stats = dct[zone]
stats = UpdateStats(stats, value, nodata)
else:
stats = CreateStats(value, nodata)
dct[zone] = stats
print "\nZone\tsum\tcnt\tmean\tmin\tmax\tcnt_neg\tcnt_pos\tcnt_nodata"
for zone, stats in sorted(dct.items()):
print zone, '\t', '\t'.join(str(a).replace('.', ',') for a in stats)
def UpdateStats(stats, value, nodata):
# sum, cnt, mean, min, max, cnt_neg, cnt_pos, cnt_nodata
if value > nodata / 2.0:
stats[0] += value
stats[1] += 1
stats[2] = float(stats[0]) / float(stats[1])
if value < stats[3]:
stats[3] = value
if value > stats[4]:
stats[4] = value
if value < 0:
stats[5] += 1
if value > 0:
stats[6] += 1
else:
stats[7] += 1
return stats
def CreateStats(value, nodata):
# sum, cnt, mean, min, max, cnt_neg, cnt_pos, cnt_nodata
if value > nodata / 2.0:
return [value, 1, value, value, value, 1 if value < 0 else 0, 1 if value > 0 else 0, 0]
else:
return [0, 0, None, 99999999, -9999999, 0, 0, 1]
if __name__ == '__main__':
main()
But once again, it is much easier following the steps as described by Dan and Jayanta.
- Mark as New
- Bookmark
- Subscribe
- Mute
- Subscribe to RSS Feed
- Permalink
Hi Xander Bakker, Thank you very much. Really very interesting script. And yes the step described by Dan Patterson and Jayanta Poddar is very easier to understand.
And This script is one more step ahead rather than producing two different rasters for Negative and positive and then count the pixel numbers by doing Zonal Statistics. So this script may save the time.
Instead of GDB file extension, can it be just file path (e.g r'D:\Raster_Statisctics\Count_Pixel\Zones). And it can be possible to use direct Shapefile instead of raster for extracting the zone information.
I ran the script, but I am getting an error. I think the problem with my Zone's raster. I had a zone vector file (Attached below), which I converted it to a raster format in same spatial resolution as values_ras.
I have attached my file which I am using for counting the negative and positive pixel for each zones. Please have a look.
And the error message is :
Input path:
import numpy as np
zones_ras = r'D:\Raster_Statistics\Count_Pixel.gdb\Zones'
values_ras = r'D:\Raster_Statistics\Count_Pixel.gdb\NPP'Error message:
load modules...
create numpy rasters...
Traceback (most recent call last):
File "<module1>", line 70, in <module>
File "<module1>", line 12, in main
File "C:\Program Files\ArcGIS\Desktop10.3\ArcPy\arcpy\__init__.py", line 2244, in RasterToNumPyArray
return _RasterToNumPyArray(*args, **kwargs)
RuntimeError: ERROR 000732: Input Raster: Dataset D:\Raster_Statistics\Count_Pixel.gdb\Zones does not exist or is not supported- Mark as New
- Bookmark
- Subscribe
- Mute
- Subscribe to RSS Feed
- Permalink
In order to use a zone featureclass the script should convert the shapefile to raster, using the same extent and cell size and coordinate system in order for the numpy arrays to align and to read out the zone and raster value that correspond. Using a TIF raster in stead of a GDB raster might work, but maybe the nodata value is different and the code should be adapted for that.
When you do a Zonal Statistics as Table on the negative and positive values rasters and create all the statistics, you will have many relevant statistics. In my code the mean is calculated on negative and positive values together, when you might be interested in knowing those statistics for only the positive and negative values in a zone.
- Mark as New
- Bookmark
- Subscribe
- Mute
- Subscribe to RSS Feed
- Permalink
Hi Xander Bakker Thank you.
I ran the code but the same error I am getting which I mentioned above. Please, could you check, where is the problem.
I have made the gdb file using below code,
import os
import sys
from arcpy import env
import arcpy
env.workspace = "D:\Raster_Statistics\Count_Pixel"
# Set local variables
out_folder_path = "D:\Raster_Statistics\Count_Pixel"
out_name = "Count.gdb"
# Execute CreateFileGDB
arcpy.CreateFileGDB_management(out_folder_path, out_name)While I using the Count_Pixel.gdb as an input path, that time it's producing the error. I think somewhere name of Zone is not matching.
if you can attach the data (Zone_ras and value_ras) which you used for generating the result, so I can compare and check with my data.
Thank you
- Mark as New
- Bookmark
- Subscribe
- Mute
- Subscribe to RSS Feed
- Permalink
Shouvik,
In Python, the path of a Windows Directory should be mentioned as
r"D:\Raster_Statistics\Count_Pixel"or
"D:/Raster_Statistics/Count_Pixel"Think Location