- Home
- :
- All Communities
- :
- Developers
- :
- Python
- :
- Python Questions
- :
- Re: Correlation between two different rasters
- Subscribe to RSS Feed
- Mark Topic as New
- Mark Topic as Read
- Float this Topic for Current User
- Bookmark
- Subscribe
- Mute
- Printer Friendly Page
- Mark as New
- Bookmark
- Subscribe
- Mute
- Subscribe to RSS Feed
- Permalink
- Report Inappropriate Content
Xander Bakker, Heartly thanks for the Trendline script. It will help you many of GIS users. One more query since long I have,
Just a few months back I posted one query regarding Correlation between two different rasters (Example: for X parameter 13 rasters and for Y parameter also the same numbers of raster) and output correlation would be raster format and spatial map of correlation raster will indicate the how two parameters are correlated, value of output -1 to +1.
I got the response from you, but that code performs based on randomly generated point data over the raster and its created the correlation graph.
As we know the spatial map of correlation can be easy and much better to understand and explain the relationship while we talking about the how X and Y correlated and variation over any region.
I searched it, and many of Python user has been asked but not come out with a proper solution yet.
Please, can you share your opinion, how it could be done in python?
Thanks & regards
Shouvik Jha
Solved! Go to Solution.
- Mark as New
- Bookmark
- Subscribe
- Mute
- Subscribe to RSS Feed
- Permalink
- Report Inappropriate Content
I will have to look into that problem of the additional line. Since the raster was moved 1 pixel, I moved it using the georeferencing toolbar and used map algebra after setting the environment settings to match the NPP raster(s).
I thought I had attached the raster, but it seems that I didn't. Sorry, will attach it now (16.9 MB)...
- Mark as New
- Bookmark
- Subscribe
- Mute
- Subscribe to RSS Feed
- Permalink
- Report Inappropriate Content
Hi, Xander Bakker, Thanks for sharing the output raster. Really it's quite interesting result.
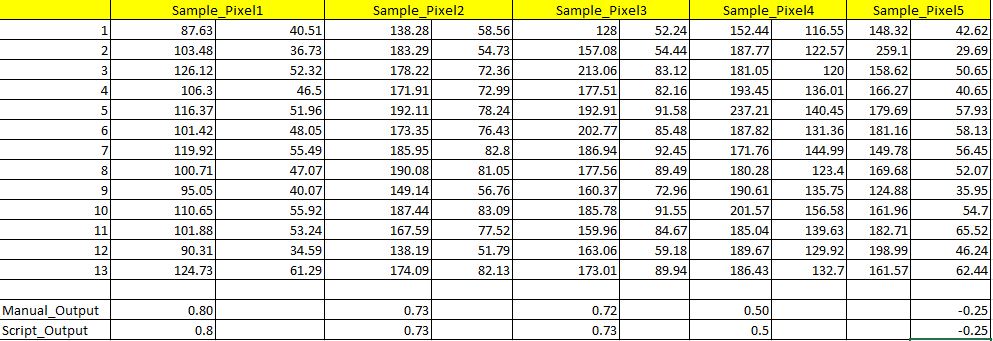
I have cross checked the output raster which is attached by you, the output correlation raster is matched exactly with pixel wise calculation.
Here-with i have attached the comparison between manual Vs Script result.
But how you corrected the output raster, i did not understand the line by you "the georeferencing toolbar and used map algebra after setting the environment settings to match the NPP raster(s)"
Please explain how you use the georeferencing toolbar and map algebra.
Once again hearty gratitude for such wonderful script.
Thanks & regards
Shouvik Jha
- Mark as New
- Bookmark
- Subscribe
- Mute
- Subscribe to RSS Feed
- Permalink
- Report Inappropriate Content
Sure, I will get back to that later, due to some meetings, and include some screenshots to explain the steps.
- Mark as New
- Bookmark
- Subscribe
- Mute
- Subscribe to RSS Feed
- Permalink
- Report Inappropriate Content
So if you zoom in to one of the input rasters you will see something like this:

.. loading the original output raster on top´of it shows:

You can clearly see that the raster is shifted one pixel towards the north.
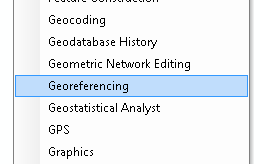
To correct this activate the Georeferencing toolbar:
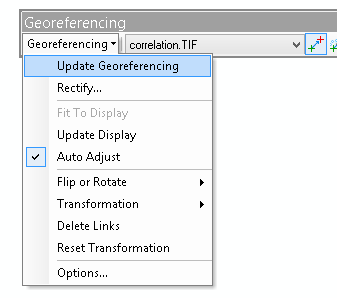
and make sure that the "correlation.TIF" raster is selected:

Activate the "Add Control Points" button:

Click in a corner of a pixel and click on the same corner of the pixel below the pixel:

This will move the pixel directly 1 pixel downwards.
Update the georeferencing:
In order to correct the number of lines and make sure the pixels line up exactly. Go into the geoprocessing environments (menu Geoprocessing, option Environments).
Set the workspace to the folder where you want to create the final raster:

Set the output coordinates same as layer r001_NPP.tif:

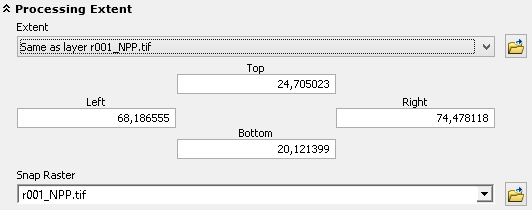
Set the processing extent and snap raster the same as layer r001_NPP.tif:
Set the raster analysis cell size the same as layer r001_NPP.tif:

Now go into the Raster Calculator and execute this simple formula:
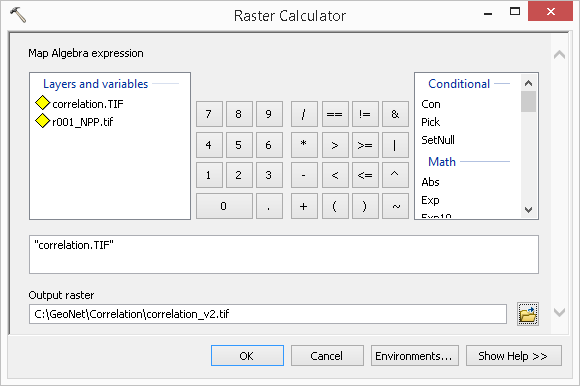
This will create a new raster applying the environment settings to the raster and create the same extent and cell size as the reference raster r001_NPP.tif
- Mark as New
- Bookmark
- Subscribe
- Mute
- Subscribe to RSS Feed
- Permalink
- Report Inappropriate Content
Hi Xander Bakker, Thanks for sharing. Really very good idea to solve the pixel shifting error.
And now everything is working perfectly.
- Mark as New
- Bookmark
- Subscribe
- Mute
- Subscribe to RSS Feed
- Permalink
- Report Inappropriate Content
Glad to hear that!
- Mark as New
- Bookmark
- Subscribe
- Mute
- Subscribe to RSS Feed
- Permalink
- Report Inappropriate Content
Hi Xander Bakker and Shouvik Jha, Thanks for sharing the awesome script.
I ran the script using more than 300 raster data X and Y respectively. I just modify the script for path and format template:
import numpy as np
template1 = r'C:\regression\correlation\data_x\x_{}.tif'
template2 = r'C:\regression\correlation\data_y\y_{}.tif'
nodata = -3.4028235e+38
out_ras = r'C:\regression\correlation.tif'
print "create nested numpy array list..."
lst_np_ras = []
for i in range(0, 334):
ras_path1 = template1.format("%01d" % (i,))
print " - ", ras_path1
ras_np1 = arcpy.RasterToNumPyArray(ras_path1)
ras_path2 = template2.format("%01d" % (i,))
print " - ", ras_path2ras_np2 =
arcpy.RasterToNumPyArray(ras_path2)lst_np_ras.append([ras_np1, ras_np2])but I get an error message
Runtime error
Traceback (most recent call last):
File "<string>", line 102, in <module>
File "<string>", line 78, in main
RuntimeError: ERROR 010240: Could not save raster dataset to C:\regression\correlation.tif with output format TIFF.
Can you help to solve this?
Kind regards, Arwan
- Mark as New
- Bookmark
- Subscribe
- Mute
- Subscribe to RSS Feed
- Permalink
- Report Inappropriate Content
You don't show the lines where the array is being saved to a raster. And the shape of the array/raster is important as well
- Mark as New
- Bookmark
- Subscribe
- Mute
- Subscribe to RSS Feed
- Permalink
- Report Inappropriate Content
Hi Dan Patterson. Thanks for your response. Finally I succeeded to run the script after I tried restarting my computer.
- « Previous
-
- 1
- 2
- Next »
- « Previous
-
- 1
- 2
- Next »