- Home
- :
- All Communities
- :
- Developers
- :
- Python
- :
- Python Questions
- :
- Re: Correlation between two different rasters
- Subscribe to RSS Feed
- Mark Topic as New
- Mark Topic as Read
- Float this Topic for Current User
- Bookmark
- Subscribe
- Mute
- Printer Friendly Page
- Mark as New
- Bookmark
- Subscribe
- Mute
- Subscribe to RSS Feed
- Permalink
Xander Bakker, Heartly thanks for the Trendline script. It will help you many of GIS users. One more query since long I have,
Just a few months back I posted one query regarding Correlation between two different rasters (Example: for X parameter 13 rasters and for Y parameter also the same numbers of raster) and output correlation would be raster format and spatial map of correlation raster will indicate the how two parameters are correlated, value of output -1 to +1.
I got the response from you, but that code performs based on randomly generated point data over the raster and its created the correlation graph.
As we know the spatial map of correlation can be easy and much better to understand and explain the relationship while we talking about the how X and Y correlated and variation over any region.
I searched it, and many of Python user has been asked but not come out with a proper solution yet.
Please, can you share your opinion, how it could be done in python?
Thanks & regards
Shouvik Jha
Solved! Go to Solution.
Accepted Solutions
- Mark as New
- Bookmark
- Subscribe
- Mute
- Subscribe to RSS Feed
- Permalink
I noticed that the data from both parameters do not align exactly. Cell sizes are not the same and therefore the extent is also different. It is important that they align exactly for the process to work correctly (that the correct pixels from both list of datasets are used in the correlation).
 vs
vs 
and
 vs
vs 
resulting in a shift:

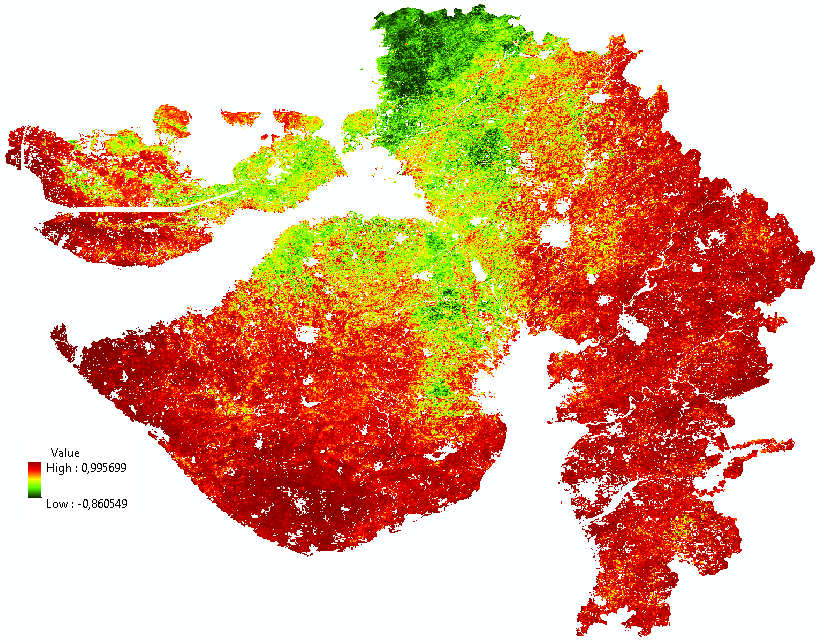
There is also something weird going on with the script. Although the raster properties indicate that there are 1994 lines, a raster with 1995 lines is created and since the the properties of the original raster are used to define the lower left corner for translating the numpy array back to a raster, this results in a shift in 1 pixel. I have manually corrected the shift and attached the resulting correlation raster for you to examine.

The code used is list below:
#-------------------------------------------------------------------------------
# Name: correlation_2_sets_of_rasters.py
# Purpose:
#
# Author: Xander
#
# Created: 03-08-2017
#-------------------------------------------------------------------------------
def main():
print "load modules..."
import arcpy
arcpy.env.overwriteOutput = True
import numpy as np
template1 = r'C:\GeoNet\Correlation\Parameter1\r{0}_NPP.TIF'
template2 = r'C:\GeoNet\Correlation\Parameter2\r{0}_WUE.TIF'
nodata = -3.4028235e+38
out_ras = r'C:\GeoNet\Correlation\correlation.TIF'
print "create nested numpy array list..."
lst_np_ras = []
for i in range(1, 14):
ras_path1 = template1.format("%03d" % (i,))
print " - ", ras_path1
ras_np1 = arcpy.RasterToNumPyArray(ras_path1)
ras_path2 = template2.format("%03d" % (i,))
print " - ", ras_path2
ras_np2 = arcpy.RasterToNumPyArray(ras_path2)
lst_np_ras.append([ras_np1, ras_np2])
print "read props numpy raster..."
ras_np = lst_np_ras[0][0] # take first numpy array from list
rows = ras_np.shape[0]
cols = ras_np.shape[1]
print " - rows:", rows
print " - cols:", cols
print "create output numpy array..."
ras_path = template1.format("%03d" % (1,))
raster = arcpy.Raster(ras_path)
ras_np_res = np.ndarray((rows, cols))
print " - out rows:", ras_np_res.shape[0]
print " - out cols:", ras_np_res.shape[1]
print "loop through pixels..."
pix_cnt = 0
for row in range(rows):
for col in range(cols):
pix_cnt += 1
if pix_cnt % 5000 == 0:
print " - row:", row, " col:", col, " pixel:", pix_cnt
lst_vals1 = []
lst_vals2 = []
try:
for lst_pars in lst_np_ras:
lst_vals1.append(lst_pars[0][row, col])
lst_vals2.append(lst_pars[1][row, col])
lst_vals1 = ReplaceNoData(lst_vals1, nodata)
lst_vals2 = ReplaceNoData(lst_vals2, nodata)
# perform calculation on list
correlation = CalculateCorrelation(lst_vals1, lst_vals2, nodata)
ras_np_res[row, col] = correlation
except Exception as e:
print "ERR:", e
print " - row:", row, " col:", col, " pixel:", pix_cnt
print " - lst_vals1:", lst_vals1
print " - lst_vals2:", lst_vals2
pnt = arcpy.Point(raster.extent.XMin, raster.extent.YMin) # - raster.meanCellHeight
xcellsize = raster.meanCellWidth
ycellsize = raster.meanCellHeight
print "Write output raster..."
print " - ", out_ras
ras_res = arcpy.NumPyArrayToRaster(ras_np_res, lower_left_corner=pnt, x_cell_size=xcellsize,
y_cell_size=ycellsize, value_to_nodata=nodata)
ras_res.save(out_ras)
arcpy.DefineProjection_management(in_dataset=out_ras, coor_system="GEOGCS['GCS_WGS_1984',DATUM['D_WGS_1984',SPHEROID['WGS_1984',6378137.0,298.257223563]],PRIMEM['Greenwich',0.0],UNIT['Degree',0.0174532925199433]]")
def CalculateCorrelation(a, b, nodata):
import numpy
try:
coef = numpy.corrcoef(a,b)
return coef[0][1]
except:
return nodata
def ReplaceNoData(lst, nodata):
res = []
for a in lst:
if a < nodata / 2.0:
res.append(None)
else:
res.append(a)
return res
if __name__ == '__main__':
main()
Kind regards, Xander
- Mark as New
- Bookmark
- Subscribe
- Mute
- Subscribe to RSS Feed
- Permalink
Hi shouvik jha , are you referring to this thread: Scatter plot of two rasters or is it another one, since I see several related threads?
If you want to compare each of the 13 rasters with the other rasters, this yields 78 possible combinations (if for instance comparing 13 to 10 is the same as 10 to 13). If you plot all of these in the same plot this will be very dense and probably impossible to interpret. Or do you want to generate a graph for each comparison?
You could use the numpy rasters to query the values and generate the lists for the plot, but there will be a lot of possibilities and I'm not sure is there might be memory issues or size restrictions for generating the plots, but I'm sure it must be possible. Do you want to do this for the 13 rasters you attached to this thread?
- Mark as New
- Bookmark
- Subscribe
- Mute
- Subscribe to RSS Feed
- Permalink
Hi Xander Bakker, Yes i was talking about that thread only, but presently what I am talking is something different.
lets we have two parameters. one just assumes Temperature and precipitation raster for 13 years. For calculating correlation we need some data points from both parameters.
So this time we have two parameters, each parameter has 13 raster maps.one is WUE (Already we worked on that data) and another one vegetation density. So it will just calculate pixel basis correlation, value comes from 2 different. parameters over 13 rasters.
If we take single pixel from both parameters of 13 rasters, so value would be like
| All value comes from single grid point. | WUE raster | Vegetation density raster |
|---|---|---|
| raster1 | 200 | 100 |
| raster2 | 250 | 120 |
| raster3 | 300 | 130 |
| raster4 | 350 | 150 |
| raster5 | 250 | 120 |
| raster6 | 150 | 100 |
| raster7 | 120 | 140 |
| raster8 | 130 | 150 |
| raster9 so on | 50 | 100 |
based on this value correlation coefficient is 0.36. Calculated in Excel "CORREL" command.
I want similar calculation on the different grid basis and correlation value will be in raster format. Hope I explained properly. If you want some data, I can share with you.
thanks
- Mark as New
- Bookmark
- Subscribe
- Mute
- Subscribe to RSS Feed
- Permalink
If I understand you correctly, you want to extract for each pixel, 26 values (13 values from the WUE rasters and 13 values from the vegetation density rasters), calculate the correlation and write back the correlation value in the output raster. Is that correct?
- Mark as New
- Bookmark
- Subscribe
- Mute
- Subscribe to RSS Feed
- Permalink
Yes, exactly the same things.
- Mark as New
- Bookmark
- Subscribe
- Mute
- Subscribe to RSS Feed
- Permalink
I am attaching my data, for your reference purpose.
- Mark as New
- Bookmark
- Subscribe
- Mute
- Subscribe to RSS Feed
- Permalink
Hi Bakker , i have attached the data link for the reference purpose. Kindly have a look.
Data link : Dropbox - Data.zip
Thanks & regards
Shouvik Jha
- Mark as New
- Bookmark
- Subscribe
- Mute
- Subscribe to RSS Feed
- Permalink
Hi india123 , I branched this part to a new question and will download the data to see what is possible.
Kind regards, Xander
- Mark as New
- Bookmark
- Subscribe
- Mute
- Subscribe to RSS Feed
- Permalink
I noticed that the data from both parameters do not align exactly. Cell sizes are not the same and therefore the extent is also different. It is important that they align exactly for the process to work correctly (that the correct pixels from both list of datasets are used in the correlation).
 vs
vs 
and
 vs
vs 
resulting in a shift:

There is also something weird going on with the script. Although the raster properties indicate that there are 1994 lines, a raster with 1995 lines is created and since the the properties of the original raster are used to define the lower left corner for translating the numpy array back to a raster, this results in a shift in 1 pixel. I have manually corrected the shift and attached the resulting correlation raster for you to examine.

The code used is list below:
#-------------------------------------------------------------------------------
# Name: correlation_2_sets_of_rasters.py
# Purpose:
#
# Author: Xander
#
# Created: 03-08-2017
#-------------------------------------------------------------------------------
def main():
print "load modules..."
import arcpy
arcpy.env.overwriteOutput = True
import numpy as np
template1 = r'C:\GeoNet\Correlation\Parameter1\r{0}_NPP.TIF'
template2 = r'C:\GeoNet\Correlation\Parameter2\r{0}_WUE.TIF'
nodata = -3.4028235e+38
out_ras = r'C:\GeoNet\Correlation\correlation.TIF'
print "create nested numpy array list..."
lst_np_ras = []
for i in range(1, 14):
ras_path1 = template1.format("%03d" % (i,))
print " - ", ras_path1
ras_np1 = arcpy.RasterToNumPyArray(ras_path1)
ras_path2 = template2.format("%03d" % (i,))
print " - ", ras_path2
ras_np2 = arcpy.RasterToNumPyArray(ras_path2)
lst_np_ras.append([ras_np1, ras_np2])
print "read props numpy raster..."
ras_np = lst_np_ras[0][0] # take first numpy array from list
rows = ras_np.shape[0]
cols = ras_np.shape[1]
print " - rows:", rows
print " - cols:", cols
print "create output numpy array..."
ras_path = template1.format("%03d" % (1,))
raster = arcpy.Raster(ras_path)
ras_np_res = np.ndarray((rows, cols))
print " - out rows:", ras_np_res.shape[0]
print " - out cols:", ras_np_res.shape[1]
print "loop through pixels..."
pix_cnt = 0
for row in range(rows):
for col in range(cols):
pix_cnt += 1
if pix_cnt % 5000 == 0:
print " - row:", row, " col:", col, " pixel:", pix_cnt
lst_vals1 = []
lst_vals2 = []
try:
for lst_pars in lst_np_ras:
lst_vals1.append(lst_pars[0][row, col])
lst_vals2.append(lst_pars[1][row, col])
lst_vals1 = ReplaceNoData(lst_vals1, nodata)
lst_vals2 = ReplaceNoData(lst_vals2, nodata)
# perform calculation on list
correlation = CalculateCorrelation(lst_vals1, lst_vals2, nodata)
ras_np_res[row, col] = correlation
except Exception as e:
print "ERR:", e
print " - row:", row, " col:", col, " pixel:", pix_cnt
print " - lst_vals1:", lst_vals1
print " - lst_vals2:", lst_vals2
pnt = arcpy.Point(raster.extent.XMin, raster.extent.YMin) # - raster.meanCellHeight
xcellsize = raster.meanCellWidth
ycellsize = raster.meanCellHeight
print "Write output raster..."
print " - ", out_ras
ras_res = arcpy.NumPyArrayToRaster(ras_np_res, lower_left_corner=pnt, x_cell_size=xcellsize,
y_cell_size=ycellsize, value_to_nodata=nodata)
ras_res.save(out_ras)
arcpy.DefineProjection_management(in_dataset=out_ras, coor_system="GEOGCS['GCS_WGS_1984',DATUM['D_WGS_1984',SPHEROID['WGS_1984',6378137.0,298.257223563]],PRIMEM['Greenwich',0.0],UNIT['Degree',0.0174532925199433]]")
def CalculateCorrelation(a, b, nodata):
import numpy
try:
coef = numpy.corrcoef(a,b)
return coef[0][1]
except:
return nodata
def ReplaceNoData(lst, nodata):
res = []
for a in lst:
if a < nodata / 2.0:
res.append(None)
else:
res.append(a)
return res
if __name__ == '__main__':
main()
Kind regards, Xander
- Mark as New
- Bookmark
- Subscribe
- Mute
- Subscribe to RSS Feed
- Permalink
Hi Xander Bakker, Thank you so much. Really a very wonderful script.
please, can you attach the output raster which you got.
I ran the script but the same issue with me also, it's producing one more row.
After reading your comments, I USE the clip function in ArcGIS to bring the same extent as the parameter1 have. But the same issue persisting.
Please tell me, how you manually correct that.
Once again thanks for the interesting and very useful script.
Thanks & regards
Shouvik Jha