- Home
- :
- All Communities
- :
- Developers
- :
- Python
- :
- Python Questions
- :
- Convert Summary Table Structure (Using Python)
- Subscribe to RSS Feed
- Mark Topic as New
- Mark Topic as Read
- Float this Topic for Current User
- Bookmark
- Subscribe
- Mute
- Printer Friendly Page
Convert Summary Table Structure (Using Python)
- Mark as New
- Bookmark
- Subscribe
- Mute
- Subscribe to RSS Feed
- Permalink
I originally posted the question under the following post: Python solution to convert single column into multiple columns but its seems I didn't explain clearly what I'm trying to achieve. I hope the following is a lot clearer as I desperately need to solve the following as I have few hundred table to process.
I have generated summary statistics tables based on the results of an intersection. The summary statistics table format is as per below:
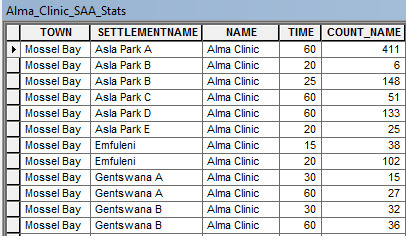
if you look at the following table as an example:
- Mossel Bay, Asla Park B, Alma Clinic appears twice as there 6 buildings found within 20 minutes and 148 buildings within 25 minutes.
I need to convert the table structure so that there is one entry for:
- Mossel Bay, Also Park B, Alma Clinic with the TIME field being split per interval (i.e. 5min, 10min - 60min) with the number of buildings (COUNT_NAME) being populated within the appropriate fields as per below:
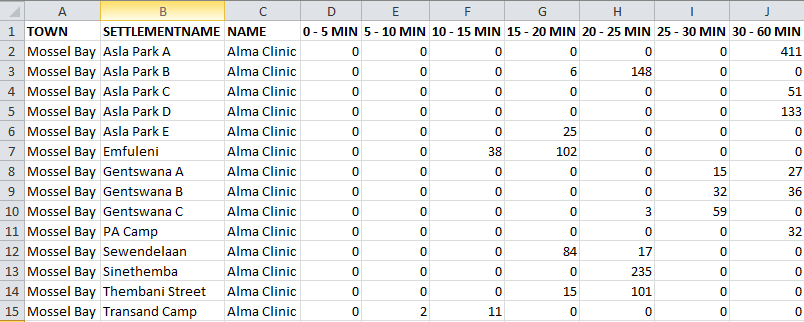
As you can see from the example above Mossel Bay, Asla Park B, Alma Clinic has a single row and the Number of buildings have been populated within the appropriate fields per time interval.
I've tried using ArcPy Data Access Module with no success as the rows are not unique so insert cursor wont work, can't use the update cursor as I'm trying to populate an empty table.
I was considering numpy, but would need some advice on how to get started and also considered python dictionaries and also realised my knowledge is limited at this stage. Any advice to solve the following would be appreciated.
- Mark as New
- Bookmark
- Subscribe
- Mute
- Subscribe to RSS Feed
- Permalink
Looks good! Pandas is a gentler interface to base numpy but may serve you well. Glad you found the recfunctions documentation (ie rfn.merge_arrays etc), it allows for joins within arrays much like we use 'join' in arcmap and arcpy.da 's extendtable ExtendTable—Data Access module | ArcGIS for Desktop the interface that esri put to the process.
If you need specific documentation or processes covered, let me know or if you want a panda's equivalent to a numpy methodology, I can supply it. You will be well advanced for work in PRO when the time comes and need to avail yourself of access to scipy and pandas.
Keep us posted.
- Mark as New
- Bookmark
- Subscribe
- Mute
- Subscribe to RSS Feed
- Permalink
Thanks Dan
Will definitely keep you posted, thanks again for all the help, Peter
- « Previous
- Next »
- « Previous
- Next »