- Home
- :
- All Communities
- :
- Developers
- :
- Python
- :
- Python Questions
- :
- Calculating "best fit" line feature based on three...
- Subscribe to RSS Feed
- Mark Topic as New
- Mark Topic as Read
- Float this Topic for Current User
- Bookmark
- Subscribe
- Mute
- Printer Friendly Page
Calculating "best fit" line feature based on three height values
- Mark as New
- Bookmark
- Subscribe
- Mute
- Subscribe to RSS Feed
- Permalink
Hi
I have line features representing overhead power lines, and for these power lines, I have height attribute values at three different locations: the start of the line, the end of the line and (using a distance attribute from start) the point of maximal sag of the line between start and end points. I do not want to create straight lines between start point, sag point and end point but a curved line of best fit between the three points. Note that the "sag" point is not always midway between the start and end point. I need to do this in a python program as I have to calculate this for a large volume of lines, so the editing "arc" tool is not really something I can use.
I looked into trying to fit an ellipsoid between the points but that is no good as this would mean I have one ellipsoid between start point and sag point and another ellipsoid between sag point and end point. I need a single curve that fits all three points. I tried the spline tool, which creates a raster surface from points (which means I can perhaps get back from raster to more points), but 3 points is not enough to create a raster surface. I also tried non spatial tools such as scipy interpolate (fitting a spline between sets of np.array values), but here also, I only have 3 points which is not sufficient to do the interpolation and create the "spline" line.
Anyone knows how to create a curve of best fit between three point locations? In my case these points are z (height) values so either a curved "best fit" line is calculated directly or intermediate points are calculated from which I create a new line feature. However, in that case I also would have to find the X and Y coordinates of the newly created (intermediate) z height values.
Difficult problem, I know, I am just wondering if someone has worked this out, or can help me in any way.
Thanks very much.
Hugo
- Mark as New
- Bookmark
- Subscribe
- Mute
- Subscribe to RSS Feed
- Permalink
If you’ve got three points couldn’t you fit a polynomial equation to the three points (x = 0,1,2; y = first point, sag point, last point)?
i think that could give you the equation at least for the one Z axis I think?
- Mark as New
- Bookmark
- Subscribe
- Mute
- Subscribe to RSS Feed
- Permalink
This is effectively a "circle through three points". Either the circle solution or a "best-fit" solution.
Assuming that the 3 points are on the same line, you can convert the data so that the x-variable is distance and the y-variable is your z.
Your distances would be 0 (ie the start point), distance to sag point, distance to end point.
Your z values become y.
Solve for the equation and generate other points as needed.
The equation would be degenerate if the line was completely straight.
Assumptions:
This would work best if the sag point were in the middle of the span.
The length of cable relative to the distance between end points should be "uniform" so that the cable behaves in a similar fashion along its total length. (sloppy install with over or under tension will result in different deflections per unit length)
If there is significant elevation differences between the start and end points, the location of the sag point may shift significantly to the lower elevation end and the circle assumption would be void.
In those cases, you would have to consider a best-fit circle or ellipse through the points rather than a circle itself.
Best fit ellipses could be used, but "usually" at least 5 points are needed but code exists to handle situations like yours, but the effort is large.
There is little point in working on this with 3 dimensions given that the span should form a straight line with the sag point somewhere along the line. Translation and rotation to and from the initial coordinate system is covered by standard affine equations.
Final note. Before you begin on this venture, it would be useful to examine some of your transformed data to get an initial estimate of sag location and value relative to span length and span elevation difference.
... sort of retired...
- Mark as New
- Bookmark
- Subscribe
- Mute
- Subscribe to RSS Feed
- Permalink
out of curiosity do you know the XYZ for each of the Start, End and Sag points?
- Mark as New
- Bookmark
- Subscribe
- Mute
- Subscribe to RSS Feed
- Permalink
Yes I do, but it still means there are only 3 locations to work from in 3D space.
Get Outlook for iOS<https://aka.ms/o0ukef>
- Mark as New
- Bookmark
- Subscribe
- Mute
- Subscribe to RSS Feed
- Permalink
Are you trying to model a catenary curve between your points then? From my understanding that's the curve that would match a cable hanging problem like you've described.
I might have a solution but since the scale of the curve is dependent on the horizontal/vertical distance of the points it would be nice to try with some confirmed data. Are you able to share a few of your sample locations? If you'd like to dummy them up all I really need is horizontal distance between start and sag, sag and end, and the vertical locations of the start, sag and end. You could also just represent the sag location as a % of the whole distance if you'd like to generalize more. Important bit is vertical locations.
Example:
| ID | Start to Sag (m) | Sag to End (m) | Start Z | Sag Z | End Z |
|---|---|---|---|---|---|
| 1 | 5 (50% of total) | 5 | 50 | 30 | 50 |
| 2 | 8 (44.444% of total) | 10 | 30 | 20 | 40 |
- Mark as New
- Bookmark
- Subscribe
- Mute
- Subscribe to RSS Feed
- Permalink
Then it could get real ugly, especially if the end points are at different elevations.
... sort of retired...
- Mark as New
- Bookmark
- Subscribe
- Mute
- Subscribe to RSS Feed
- Permalink
Yes, the curve will change based on the distance and elevation.
If you already know the start/sag/end XYZ you should be able to solve the curve for the shape though through some iteration.
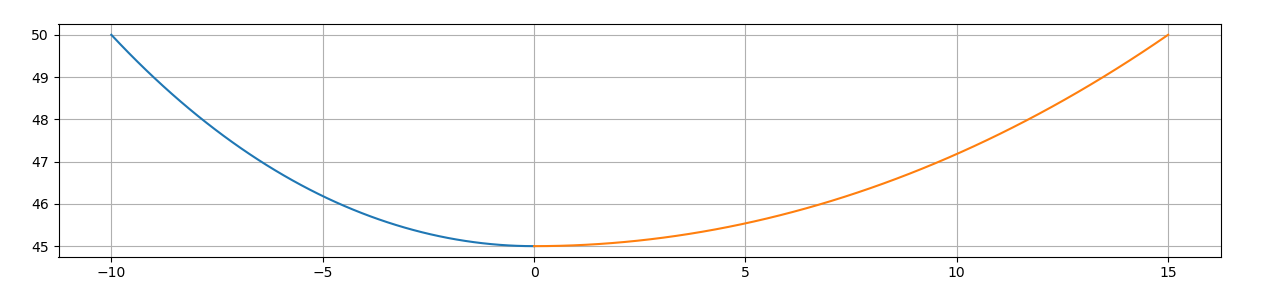
i did this as a quick test that you're welcome to try/confirm if correct or not.
- Mark as New
- Bookmark
- Subscribe
- Mute
- Subscribe to RSS Feed
- Permalink
That look good. Having some real world data would be interesting to see if the sag is relatively the same for segments with similar elevation differences
... sort of retired...
- Mark as New
- Bookmark
- Subscribe
- Mute
- Subscribe to RSS Feed
- Permalink
awesome. that array in the gist should be [distance from start to sag, distance from sag to end, start Z, sag Z, end Z]. I'm curious if you run it on some of your data with different start/end elevations how the profile plots too.
the function should let you generate your Z locations for your polyline vertexes, which you would just need to calculate over the start to end for the feature. essentially that would be the % along the line from start to sag/sag to end for the respective functions. then just use arcpy to update the polyline with your new vertex attributes.
do this for ever feature and you should be set!