- Home
- :
- All Communities
- :
- Developers
- :
- Python
- :
- Python Questions
- :
- Re: Calculate mean in 8 day intervals for thousand...
- Subscribe to RSS Feed
- Mark Topic as New
- Mark Topic as Read
- Float this Topic for Current User
- Bookmark
- Subscribe
- Mute
- Printer Friendly Page
Calculate mean in 8 day intervals for thousand of daily raster files using cell statistics
- Mark as New
- Bookmark
- Subscribe
- Mute
- Subscribe to RSS Feed
- Permalink
Hi everyone, I have folder with thousands of average daily relative humidity raster files that I would like to use cell statistics to calculate the mean in 8 day intervals. The data has dates in the format YYYYMMDD. I've looked at a similar code written after a similar question was asked but it doesnt do the 8 day averaging. I've included the link to the other answered question and a picture of what the data look like. Your help is greatly appreciated.Calculate daily average of raster files based on their names in python xander_bakker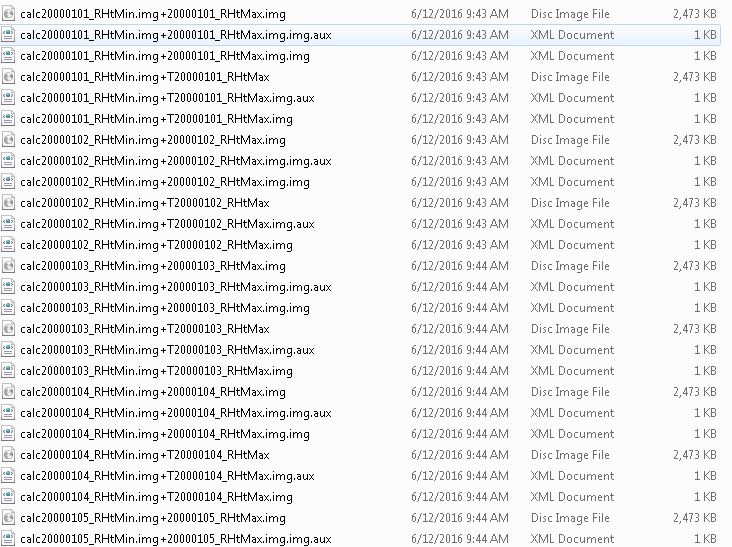
Solved! Go to Solution.
- Mark as New
- Bookmark
- Subscribe
- Mute
- Subscribe to RSS Feed
- Permalink
It is good to hear that the files open correctly. In case the dates are consecutive and there will always be 8 elements for each calculation, I guess the chunk method mentioned in the thread referenced by Dan should work. I just ran this snippet:
def main():
import os
my_list = ["calc200601{0}.img".format("%02d" % (a,)) for a in range(1, 31)]
out_ext = ".tif"
for my_list_chunk in chunks(my_list, 8):
first_name = my_list_chunk[0]
name, ext = os.path.splitext(first_name)
first_date = name[-8:]
out_ras_name = "mean" + first_date + out_ext
print out_ras_name, my_list_chunk
def chunks(l, n):
""" Yield successive n-sized chunks from l."""
for i in xrange(0, len(l), n):
yield l[i:i+n]
if __name__ == '__main__':
main()Which yielded:
mean20060101.tif ['calc20060101.img', 'calc20060102.img', 'calc20060103.img', 'calc20060104.img', 'calc20060105.img', 'calc20060106.img', 'calc20060107.img', 'calc20060108.img']
mean20060109.tif ['calc20060109.img', 'calc20060110.img', 'calc20060111.img', 'calc20060112.img', 'calc20060113.img', 'calc20060114.img', 'calc20060115.img', 'calc20060116.img']
mean20060117.tif ['calc20060117.img', 'calc20060118.img', 'calc20060119.img', 'calc20060120.img', 'calc20060121.img', 'calc20060122.img', 'calc20060123.img', 'calc20060124.img']
mean20060125.tif ['calc20060125.img', 'calc20060126.img', 'calc20060127.img', 'calc20060128.img', 'calc20060129.img', 'calc20060130.img']So, each chunk contains 8 rasters and the output raster takes the date of the first raster. In this case I added the .tif extension, but you could leave that extension off to create a Esri grid in a folder or point to an output fgdb.
To validate is this shell works, could you run the snippet below and see if this splits the list of raster up into the chunks you want?
def main():
import arcpy
import os
# change this folder to the folder with the renamed img files
input_folder = r'C:\GeoNet\Average8Days\output_files'
out_ext = ".tif"
arcpy.env.workspace = input_folder
my_list = arcpy.ListRasters()
for my_list_chunk in chunks(my_list, 8):
first_name = my_list_chunk[0]
name, ext = os.path.splitext(first_name)
first_date = name[-8:]
out_ras_name = "mean" + first_date + out_ext
print out_ras_name, my_list_chunk
def chunks(l, n):
""" Yield successive n-sized chunks from l."""
for i in xrange(0, len(l), n):
yield l[i:i+n]
if __name__ == '__main__':
main()- Mark as New
- Bookmark
- Subscribe
- Mute
- Subscribe to RSS Feed
- Permalink
Hi Xander, works just like you said! However, as I really am a newbie to this scripting thing, I do not know where to insert the other code to run the actual cell statistics as I realise the above code just prints out the batches of 8 files. Could you please help that little bit further with where to insert the cell statistics code.
Thanks
- Mark as New
- Bookmark
- Subscribe
- Mute
- Subscribe to RSS Feed
- Permalink
Hi larry32 , can you try this code?
Change:
- input folder with .img files on line 6
- output folder or fgdb on line 9 and the corresponding extension on line 10
def main():
import arcpy
import os
# change this folder to the folder with the renamed img files
input_folder = r'C:\GeoNet\Average8Days\output_files'
# define the output workspace and extension
output_ws = r'C:\GeoNet\Average8Days\gdb\myFileGeoDB.gdb'
out_ext = ""
# create list of rasters in input workspace
arcpy.env.workspace = input_folder
my_list = arcpy.ListRasters()
# checkout a Spatial Analyst license
arcpy.CheckExtension("Spatial")
# loop through chunks of 8 rasters
for my_list_chunk in chunks(my_list, 8):
# define the output name
first_name = my_list_chunk[0]
name, ext = os.path.splitext(first_name)
first_date = name[-8:]
out_ras_name = "mean" + first_date + out_ext
print out_ras_name, my_list_chunk
# now we have:
# - an output raster filename
# - the list of rasters for calculating the mean value
# perform the cellstatistics with MEAN
cellstat = arcpy.sa.CellStatistics(my_list_chunk, "MEAN", "DATA")
# define file path of output raster and save cell statistics result
outname = os.path.join(output_ws, out_ras_name)
cellstat.save(outname)
def chunks(l, n):
""" Yield successive n-sized chunks from l."""
for i in xrange(0, len(l), n):
yield l[i:i+n]
if __name__ == '__main__':
main()- Mark as New
- Bookmark
- Subscribe
- Mute
- Subscribe to RSS Feed
- Permalink
Thanks Xander! Works like a dream. Very quick too.
Thanks Dan for the useful comments. I appreciate it all.
- « Previous
-
- 1
- 2
- Next »
- « Previous
-
- 1
- 2
- Next »