- Home
- :
- All Communities
- :
- Developers
- :
- Python
- :
- Python Questions
- :
- Bar Chart - python/matplotlib
- Subscribe to RSS Feed
- Mark Topic as New
- Mark Topic as Read
- Float this Topic for Current User
- Bookmark
- Subscribe
- Mute
- Printer Friendly Page
- Mark as New
- Bookmark
- Subscribe
- Mute
- Subscribe to RSS Feed
- Permalink
I have a python script that does a variety of things within ArcMap. Within that script, I output a list (generated from a loop that appends to it) that gives me this:
[[['AB', 2.76]], [['D', 3.95]], [['E', 6.22]], [['F', 7.23]], [['G', 9.51]], [['H', 10.69]], [['I', 11.11]], [['J', 11.65]], [['K', 11.82]], [['L', 12.11]], [['M', 13.37]], [['N', 14.04]], [['O', 15.11]], [['P', 15.44]]]
I need to create a bar chart, using matplotlib from this list. This is what I have done:
xs = np.arange(len(gphList))
data = np.array(gphList)
labels, y1 = data.T
ys = y1.astype(float)
plt.bar(xs, ys, color="black")
There is a bit more, but it fails at the plt.bar line, and I can't figure out why.
My "data" gives me this:
[[['AB' '2.76']]
[['D' '3.95']]
[['E' '6.22']]
[['F' '7.23']]
[['G' '9.51']]
[['H' '10.69']]
[['I' '11.11']]
[['J' '11.65']]
[['K' '11.82']]
[['L' '12.11']]
[['M' '13.37']]
[['N' '14.04']]
[['O' '15.11']]
[['P' '15.44']]]
My "xs" gives me:
[ 0 1 2 3 4 5 6 7 8 9 10 11 12 13]
My "ys" gives me:
[[ 2.76 3.95 6.22 7.23 9.51 10.69 11.11 11.65 11.82 12.11 13.37 14.04 15.11 15.44]]
And my "labels" gives me:
[['AB' 'D' 'E' 'F' 'G' 'H' 'I' 'J' 'K' 'L' 'M' 'N' 'O' 'P']]
Which all seem fine to me, but I receive this error:
ValueError: incompatible sizes: argument 'height' must be length 14 or scalar
I am really lost on why it is doing that. The height (ys) is the list of values for the height....why is it complaining? How do I make it happy?
Solved! Go to Solution.
Accepted Solutions
- Mark as New
- Bookmark
- Subscribe
- Mute
- Subscribe to RSS Feed
- Permalink
Your original construct of the data was incorrect, it had an extra dimension... try the following data and observe the steps to obtain it.
a = np.array([[['AB', 2.76]], [['D', 3.95]], [['E', 6.22]], [['F', 7.23]], [['G', 9.51]], [['H', 10.69]], [['I', 11.11]], [['J', 11.65]], [['K', 11.82]], [['L', 12.11]], [['M', 13.37]], [['N', 14.04]], [['O', 15.11]], [['P', 15.44]]])
a
Out[2]:
array([[['AB', '2.76']],
[['D', '3.95']],
[['E', '6.22']],
[['F', '7.23']],
[['G', '9.51']],
[['H', '10.69']],
[['I', '11.11']],
[['J', '11.65']],
[['K', '11.82']],
[['L', '12.11']],
[['M', '13.37']],
[['N', '14.04']],
[['O', '15.11']],
[['P', '15.44']]],
dtype='<U5')
a0 = a.squeeze() # ---- get rid of the extra dimension
a0 # ---- much better
Out[4]:
array([['AB', '2.76'],
['D', '3.95'],
['E', '6.22'],
['F', '7.23'],
['G', '9.51'],
['H', '10.69'],
['I', '11.11'],
['J', '11.65'],
['K', '11.82'],
['L', '12.11'],
['M', '13.37'],
['N', '14.04'],
['O', '15.11'],
['P', '15.44']],
dtype='<U5')
xs = np.arange(len(a0)) # ---- generate the xs
data = np.array(a0) # ---- not needed, just some renaming
labels, y1 = data.T # ---- translate the arrays and assign to labels and ys
ys = y1.astype(float)
labels # ---- check the values
Out[7]:
array(['AB', 'D', 'E', 'F', 'G', 'H', 'I', 'J', 'K', 'L', 'M', 'N', 'O',
'P'],
dtype='<U5')
ys
Out[8]:
array([ 2.76, 3.95, 6.22, 7.23, 9.51, 10.69, 11.11, 11.65,
11.82, 12.11, 13.37, 14.04, 15.11, 15.44])
xs
Out[9]: array([ 0, 1, 2, 3, 4, 5, 6, 7, 8, 9, 10, 11, 12, 13])
Now make your graph
import matplotlib.pyplot as plt
plt.bar(xs, ys, color="black")
Out[15]: <Container object of 14 artists>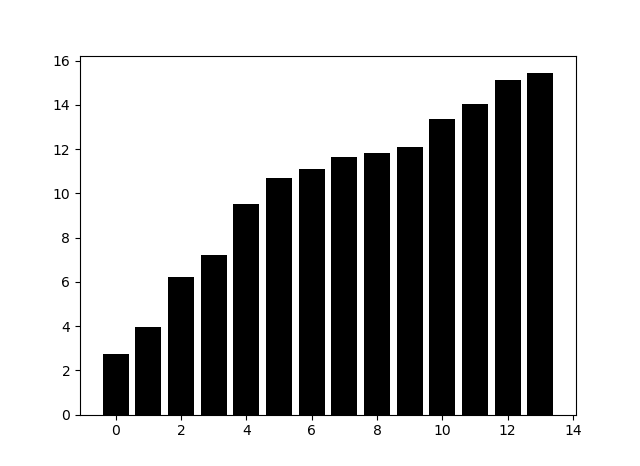
- Mark as New
- Bookmark
- Subscribe
- Mute
- Subscribe to RSS Feed
- Permalink
That was perfect, thank you so much!!!