- Home
- :
- All Communities
- :
- Developers
- :
- Python
- :
- Python Questions
- :
- Re: Automated Kriging using Python and cannot use ...
- Subscribe to RSS Feed
- Mark Topic as New
- Mark Topic as Read
- Float this Topic for Current User
- Bookmark
- Subscribe
- Mute
- Printer Friendly Page
Automated Kriging using Python and cannot use my outputs for another tool.
- Mark as New
- Bookmark
- Subscribe
- Mute
- Subscribe to RSS Feed
- Permalink
Hello,
I am trying to make a script that runs the Spatial Analyst Kriging interpolation tool on a batch of z values/fields in a point feature class. I am using the script wizard to set up the parameters, which is why you don't see the GetParameterAsText properties being defined in my code. I have run the script successfully in ArcMap 10.7.1, however I want to set symbology automatically for each Kriging output. I am failing to write the code for this and am hoping to receive some advice. Please note that I am a beginner in Python and am still learning to make customized scripts.
The issue is (despite reading help pages) I can't successfully access the output rasters (that I save with the .save() function) in my code to be used as an input for another tool.
I have been debugging lots by running the Apply Symbology From Layer tool on only individual rasters from my Kriging outputs, but the goal is to run it as a loop on all of them. This is what I have found & tried:
1. The ApplySymbologyFromLayer tool works when I run it manually in the ArcMap Python Window. This is all I have to type since the working environment is set: arcpy.ApplySymbologyFromLayer_management("Benzene", r"G:\586\FinalProject\krigingsymbology.lyr").
2. In my code, I have tried to both write the full raw path and use os.join() to access the rasters
3. The outputs I am trying to access are FGDBR rasters.
This is what I have thought of for potential solutions, but I don't want to resort to these...
1. Using the arcpy.gp.Kriging_sa instead because its parameters require a specified output name to be set, which is not the case for arcpy.sa. I could try to set the symbology property for the output parameter in the script wizard.
2. Create a whole separate tool that simply allows the Apply Symbology From Layer Tool to be run on multiple user-selected rasters.
Any help or thoughts appreciated, thank you!
This is my code (also attached below) that includes my most recent attempt to access one of the output rasters called Benzene:
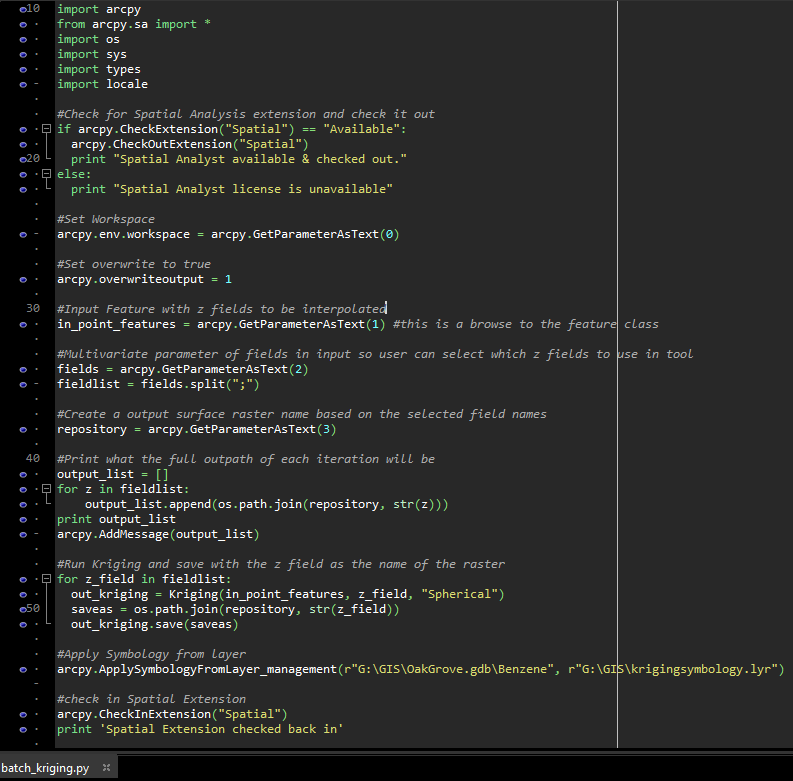
This is the error:
Running script KrigingMultipleFields...
[u'G:\\GIS\\OakGrove.gdb\\TPHg', u'G:\\GIS\\OakGrove.gdb\\Benzene']
Failed script KrigingMultipleFields...
Traceback (most recent call last):
File "G:\GIS\kriging.py", line 87, in <module>
arcpy.ApplySymbologyFromLayer_management(r"G:\GIS\OakGrove.gdb\Benzene", r"G:\GIS\krigingsymbology.lyr")
File "C:\Program Files (x86)\ArcGIS\Desktop10.7\ArcPy\arcpy\management.py", line 6944, in ApplySymbologyFromLayer
raise e
ExecuteError: Failed to execute. Parameters are not valid.
ERROR 000732: Input Layer: Dataset G:\GIS\OakGrove.gdb\Benzene does not exist or is not supported
ERROR 000968: The symbol layer does not match the input layer
Failed to execute (ApplySymbologyFromLayer).
Failed to execute (KrigingMultipleFields).
Failed at Fri Apr 24 15:39:38 2020 (Elapsed Time: 34.49 seconds)
- Mark as New
- Bookmark
- Subscribe
- Mute
- Subscribe to RSS Feed
- Permalink
overwriteOutput not overwriteoutput
haven't looked at the rest, but if you are depending on overwrites, that could be an issue
- Mark as New
- Bookmark
- Subscribe
- Mute
- Subscribe to RSS Feed
- Permalink
Thanks, Dan! That did not solve the issue I am having, but it was good to fix anyhow.
- Mark as New
- Bookmark
- Subscribe
- Mute
- Subscribe to RSS Feed
- Permalink
Next...
G:\GIS\OakGrove.gdb\Benzene .... can you confirm that it actually exists by throwing in a print statement, and, that the symbology layer and the layer that is being symbolized are of the same type. That last one may be the hard one. But you said all is good when you do it from within ArcMap. (I can't help on that since I don't use ArcMap anymoree)
- Mark as New
- Bookmark
- Subscribe
- Mute
- Subscribe to RSS Feed
- Permalink
I may not have to tell you this, because you may already be fully aware of it, but I am always highly wary of seeing people "automate" kriging interpolation...
Kriging, by its very nature, is an interactive process that IMO should not be automated. It is actually the process of exploring your data using semivariograms, crossvalidation and other tools like the ones available in Geostatistical Analyst, that make kriging a superior interpolation method over most other ones, and allow you to achieve scientifically sound quality results.
...or discover that your data set is unsuitable for interpolation! - I still quite often see people trying to interpolate stuff even in the light of exploratory data analysis showing that they shouldn't interpolate the data. Some data sets inherently cannot be reasonably interpolated, e.g. when there is almost no spatial autocorrelation between points, and likely need other kinds of statistical analysis using tools like R or SPSS. People often seem to forget this, in a desperate attempt at all cost to create a surface covering data set from a set of point measurements.
Doing away with all of that by "automation" may lead to erroneous results.
I also think the kriging interpolation options of Spatial Analyst are unsuitable for truly scientific results (that is quite a thing to say for me, because I was the original author back in the days of ArcView 3.x of the "Kriging Interpolator" extension that build upon the Spatial Analyst tools to provide a more user friendly interface). I especially say this in the light of the Geostatistical Analyst, that provides far superior options for exploratory data analysis and validation of interpolation results.
- Mark as New
- Bookmark
- Subscribe
- Mute
- Subscribe to RSS Feed
- Permalink
Thanks for the input. My question prompt was already lengthy, so I didn't provide much context about what this automation is for.
I work on site investigation and remediation in the environmental consulting industry and I plan to use this automation on a site-to-site basis, meaning the interpolation won't ever be used for more than a parcel of land. To give clients a rough idea of where the highest contamination lies on their site, a contour map is often made to include in reports. Usually only 3 to 5 contour lines are used across the site to represent how the concentration values are distributed based on the limited samples collected. The rasters I create in the automated workflow are intermediate data to be passed to the contour tool. I have compared my hand drawn contours to the outputs of every "suitable" interpolation method and Kriging has always given me the most accurate representation compared to the hand-drawn contours. These sites are often already so small and there are only a select few number of samples (between 6 to 15, based on the budget of the project) to go into analysis, that this is more for visual representation/storytelling than anything.
While I agree with your insight and wouldn't use this automation tool for a different context, it seems that Kriging is the best method for the final outputs I am trying to acquire. I'm happy to read any additional thoughts on the matter, of course.
- Mark as New
- Bookmark
- Subscribe
- Mute
- Subscribe to RSS Feed
- Permalink
Hi Megan,
My remarks were more of general note and warning to anyone reading this thread, not to specifically criticize your work. I understand the difficulties with this type of work, and also the cost involved with analysis, and how all needs to be balanced.
Sorry to have side stepped the question a bit, and not actually help you out with your problem, but good to read you managed to solve it yourself.
- Mark as New
- Bookmark
- Subscribe
- Mute
- Subscribe to RSS Feed
- Permalink
As a nice anecdote about how things can go wrong if you forget that some data sets are unsuitable for interpolation:
About 15 years ago, due to my Kriging Interpolator extension being available on ArcScripts, I was contacted by a fellow working for an environmental agency in one of the Nordic countries here in Europe. They had this fantastic data set with more than 25000 measurements of Radon gas in basements of houses across the country, including detailed data about the age, construction and condition of the house, and on what soils it was located if I remember it all well. All-in-all a treasure trove for a statistician.
Radioactive Radon gas is a health thread, and they wanted to have a country wide map showing the regions with high and low radon in houses. Ergo, they wanted to interpolate the data, at least, that was their first idea of solving this issue.
So why did he contact me then?... Turned out the data showed almost 90-100% nugget variance, and hence virtually no spatial auto-correlation, which they didn't understand.
They had this fantastically detailed data set, and now they couldn't interpolate it?!
After receiving the data, I could confirm their observation, virtually no spatial autocorrelation between Radon measurements. Even measurements in houses separated by only a small distance, could vary wildly in Radon.
So, this set me thinking, why is this? The problem is, Radon is highly correlated with the specific condition of the house: on what soil type is it located, what building materials have been use, how is the ventilation status of the basement? None of these factors are ones that necessarily have high spatial autocorrelation, with smoothly varying changes.
In fact, things like soil type and construction often vary abruptly: a soil or rock type is often abruptly changing from one spot to another, when geological processes like sedimentation, uplifting, volcanic activity etc. have changed the origin of the underground layers.
The same holds true for human influenced factors like building construction.
As a consequence, Radon in houses can vary abruptly and wildly as well in any random selection of buildings, even in the same town or even the same street.
All of this precluded interpolation as the scientific and statistical method to analyze the Radon data! And the 90-100% nugget variance showed it. Yet the fellow that contacted me, had a hard time digesting this: a fantastic data set of Radon measurements across the country, and now they couldn't interpolate it to a country wide map?
I ultimately suggested to him, to use traditional statistical methods with software like R and SPSS, to establish correlations between all the factors and conditions they had so zealously collected, and the corresponding Radon measurements in each house.
After all, this huge data set with all its measurements and ancillary data, still was a treasure trove for a statistician!
After establishing correlations, they could then use this knowledge to assess risk factors and regions at risk based on things like a geological soil map. If one or more soil types showed to be highly correlated with high Radon levels, simply classifying a geological soil map based on the statistically determined relations, might give a coarse, but statistically sound, indication of regions "at risk".
The same could be done for building construction: if some types of buildings were shown to be at risk, classifying the countries buildings based on the statistically determined risk factors, could give them an indication of the status of all buildings in the country.
- Mark as New
- Bookmark
- Subscribe
- Mute
- Subscribe to RSS Feed
- Permalink
I am teaching kriging and pattern analysis to students in the Fall - I will definitely use your very illuminating story! Thank you for sharing it.
Many read that kriging provides the BLUE (Best Linear Unbiased Estimator) and assume it is the "best" thing to use for anything. I know a very famous environment statistician that find kriging and end case - he really likes to use nonparametric methods like lowess for exploratory data analysis that do not require the (many) assumptions kriging requires!
- Mark as New
- Bookmark
- Subscribe
- Mute
- Subscribe to RSS Feed
- Permalink
Actually, one of the first things I did when receiving that data set of Radon measurements, was to simply load it in ArcView, and set a graduated color legend. That simple act of "exploratory data analysis" already showed me the kind of random nature of the measurements of the dataset, with a confetti of light and dark colors abounding.
One thing to keep in mind as well is the importance of a sense of "scale" of the phenomena you are trying to measure. E.g. if you wanted to interpolate a DEM based on height measurements in a coastal dune area, than clearly sampling one point per square kilometer isn't going to deliver results, and you just get random noise. Dunes generally vary on scales of dozens of meters (some exceptions like the ultra large coastal dunes in the Namib desert), hence you need to sample on a much finer scale.
Ground surface height is also generally not a phenomena well suited for something like (kriging) interpolation, as ground surface can vary abruptly as well (ridges, canyons etc.).
In general, it is the smoothly varying data like groundwater levels in sandy soils, pollution spreading in aquifers, ocean or the atmosphere, that shows strong spatial autocorrelation and is most suitable for interpolation.
That said, there have been some interesting developments in the past 20 years or so, also with the incorporation of new interpolation techniques in Geostatistical Analyst like "Emperical Bayesian kriging", "Indicator kriging", and "Aerial interpolation", that allow you to deal with less "standard type" of datasets (An introduction to interpolation methods—Help | Documentation )