- Home
- :
- All Communities
- :
- Developers
- :
- Python
- :
- Python Questions
- :
- Re: Any PyQt users out there?
- Subscribe to RSS Feed
- Mark Topic as New
- Mark Topic as Read
- Float this Topic for Current User
- Bookmark
- Subscribe
- Mute
- Printer Friendly Page
Any PyQt users out there?
- Mark as New
- Bookmark
- Subscribe
- Mute
- Subscribe to RSS Feed
- Permalink
I'm trying to figure out how to design and implement a GUI developed in PyQt5 and then execute a query against a SQL server data base. I'd like to take a begin date value and an end date value from two Date Edit widgets and pass those two as variables for my sql query to use in a 'Where Between' statement.
I have the python/sql queries all taken care of, and I can run them easily, but this will be for non-python, non-database users.
I can create the ui just fine, and then convert the .ui file to a .py file, which when run produces a window with the two widgets:
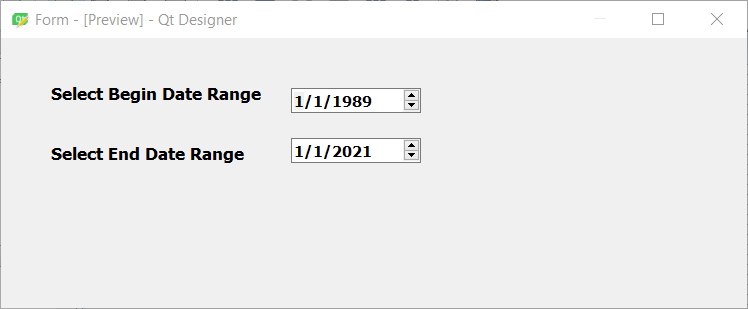
The Begin date has a default value of 1/1/89 and the while the Date is 1/1/21. Here is the part of the code that defines the window and widgets:
class Ui_Form(object):
def setupUi(self, Form):
...
...
self.dateEditStartDate.setFont(font)
self.dateEditStartDate.setDateTime(QtCore.QDateTime(QtCore.QDate(1989, 1, 1), QtCore.QTime(0, 0, 0)))
self.dateEditStartDate.setMaximumDateTime(QtCore.QDateTime(QtCore.QDate(2021, 12, 31), QtCore.QTime(23, 59, 59)))
self.dateEditStartDate.setMaximumDate(QtCore.QDate(2021, 12, 31))
self.dateEditStartDate.setMinimumDate(QtCore.QDate(1989, 1, 1))
self.dateEditStartDate.setDate(QtCore.QDate(1989, 1, 1))
self.dateEditStartDate.setObjectName("dateEditStartDate")
self.dateEditEndDate = QtWidgets.QDateEdit(Form)
self.dateEditEndDate.setGeometry(QtCore.QRect(290, 100, 130, 25))
self.dateEditEndDate.setMaximumDate(QtCore.QDate(2021, 1, 1))
self.dateEditEndDate.setMinimumDate(QtCore.QDate(1989, 1, 1))
self.dateEditEndDate.setDate(QtCore.QDate(2021, 1, 1))
self.dateEditEndDate.setObjectName("dateEditEndDate")Admittedly, I'm pretty green when it comes to using classes in python, but I think there is a way to get the values from the user input for each of the two dates, but I just don't know how to do that. Obviously there will be a bit more to my GUI, so this is just the start.
- Mark as New
- Bookmark
- Subscribe
- Mute
- Subscribe to RSS Feed
- Permalink
Not for a while... too much like this...

... sort of retired...
- Mark as New
- Bookmark
- Subscribe
- Mute
- Subscribe to RSS Feed
- Permalink
Seems more like this:

- Mark as New
- Bookmark
- Subscribe
- Mute
- Subscribe to RSS Feed
- Permalink
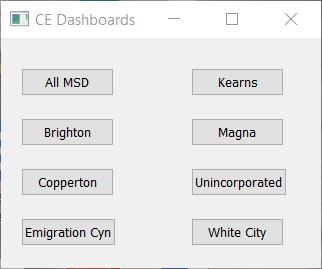
Dan Patterson- I followed this this page and came up with a gui with 8 buttons that does what I want it to do: Not what I originally posted, but the buttons open a browser tab for a specific agol-dashboard. The QT Designer is just a little much for me, but I can use it to get an idea how the set up the window and buttons but the gui below was written all as a python script. I then used pyinstaller to package up the mess, so the gui can be installed as a .exe for anyone to use. No python install needed and less than 100 lines of python code...
I'm gonna try this approach and see if I can get a text box interaction to set the variables for my sql queries....
- Mark as New
- Bookmark
- Subscribe
- Mute
- Subscribe to RSS Feed
- Permalink
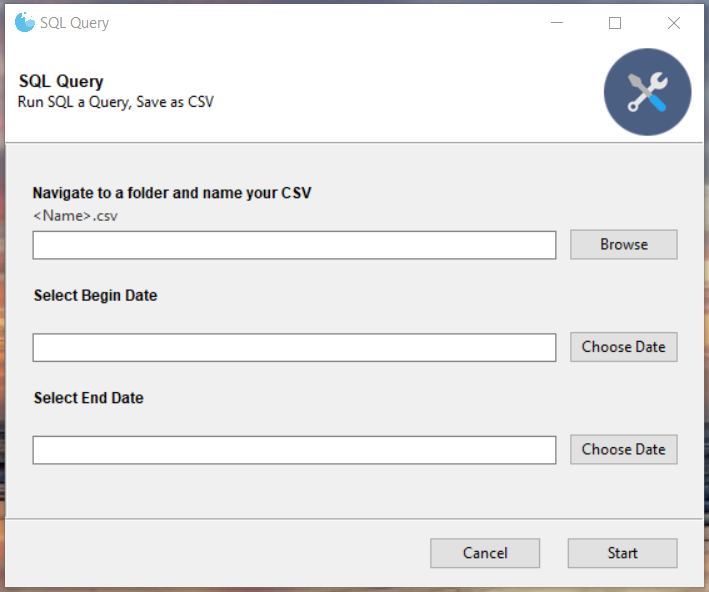
For my SQl queries based on a date range, I went a different route and use Gooey. It was suggested to me by a colleague; in less than a day I built the interface below, included a SQL query, and have it up and running with only about 80 lines of code. Each of the arguments provided by the user via the gui is parsed out and passed as variables to the sql query. If you are looking for a fairly simple to use gui builder, I highly recommend it.
This particular one uses just the two different widgets shown: one 'FileSaver' and two 'DateChooser' widgets that allow the user to navigate to a file system location and enter a .csv file name and select a date respectively.
- Mark as New
- Bookmark
- Subscribe
- Mute
- Subscribe to RSS Feed
- Permalink
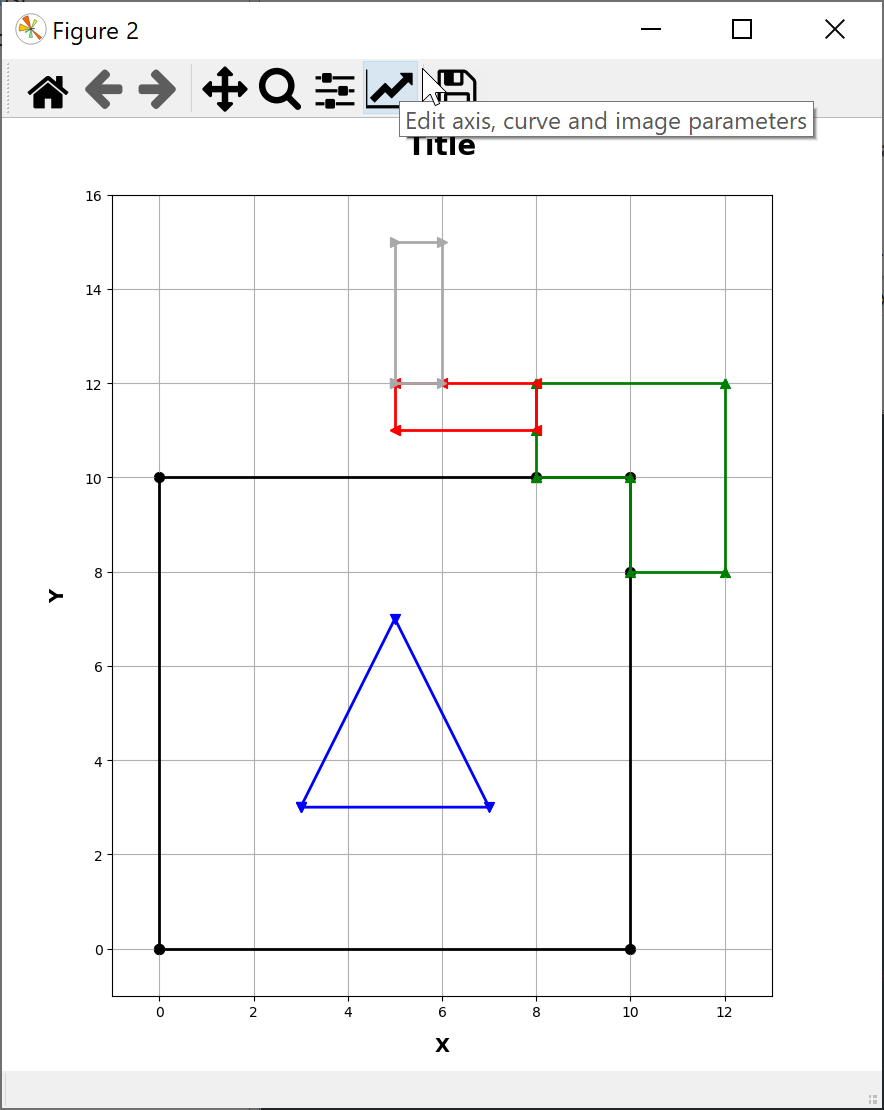
Will have a look... but I don't sql, I need graphics outputs like matplotlib and related
... sort of retired...
- Mark as New
- Bookmark
- Subscribe
- Mute
- Subscribe to RSS Feed
- Permalink
I need to familiarize myself with matplotlib. I just went to Plotting categorical variables — Matplotlib 3.2.2 documentation and downloaded the python code and ran it in spyder; the graphs then appear on the console.
- Mark as New
- Bookmark
- Subscribe
- Mute
- Subscribe to RSS Feed
- Permalink
You can set the graphs to run inline, to the new console graph or my favorite is automatic which produces a floating graph/map that you can resize and make interactive.
... sort of retired...
- Mark as New
- Bookmark
- Subscribe
- Mute
- Subscribe to RSS Feed
- Permalink
... sort of retired...