Turn on suggestions
Auto-suggest helps you quickly narrow down your search results by suggesting possible matches as you type.
Cancel
- Home
- :
- All Communities
- :
- Developers
- :
- Python
- :
- Python Questions
- :
- Add Feature to Feature Class Using Python Scriptin...
Options
- Subscribe to RSS Feed
- Mark Topic as New
- Mark Topic as Read
- Float this Topic for Current User
- Bookmark
- Subscribe
- Mute
- Printer Friendly Page
Add Feature to Feature Class Using Python Scripting
Subscribe
8448
3
01-20-2014 05:06 AM
01-20-2014
05:06 AM
- Mark as New
- Bookmark
- Subscribe
- Mute
- Subscribe to RSS Feed
- Permalink
I am a GIS Analyst and I am extremely new to Python scripting. I need to take input from a mouse click in ArcMap and then create a buffer around that point. Creating the buffer is simple, but using the location of that point as the input for the arcpy.Buffer_analysis call is tripping me up.
My initial thought was to take the location of the click and actually digitize a point there by adding the point feature to a feature class, and then use that feature class as the input for the buffer. That is the way that I would do it in ArcMap, and it would be quite simple.
Is it possible to add a feature to a feature class using a Python script?
Is it possible to gather xy input from a mouse click?
Is there a better way to acheive my goal?
Any help is greatly appreciated!
3 Replies
01-20-2014
05:46 AM
- Mark as New
- Bookmark
- Subscribe
- Mute
- Subscribe to RSS Feed
- Permalink
Hello Carly,
First off, there is an easy way to add features to a feature class with python. See insert cursor. There is some sample code at the bottom of the linked page, but feel free to ask if you hit a wall.
Getting the coordinates of a mouse-click is a little more complicated. As far as I know you would have to create a python add-in tool. The python add-ins are for 10.1 and up. They are a little hard to set up, but as long as you follow ESRI's instructions, you should be fine.
When you're creating the tool, you'll want to use onMouseDownMap and onMouseUpMap to retrieve a map coordinate from the user.
Once you're done creating your python add-in it is really easy to distribute it to a bunch of arcmap users.
Alternatively (if you wanted to avoid the whole python add-in thing), you could require the user to provide a lat and long manually, or provide a point feature class with only one point in it (which you could verify in python).
Whatever you choose, I'm sure we can provide help as you work through it.
Good luck!
~Josh
01-20-2014
10:52 AM
- Mark as New
- Bookmark
- Subscribe
- Mute
- Subscribe to RSS Feed
- Permalink
Thanks so much, John. This is great so far!
I've decided to start with taking user input of the coordinates, and then plotting the point from there. Making an add-in seems more difficult, so I think I'll work up to it.
I have figured out how to create my point feature class and take X and Y input from the user.
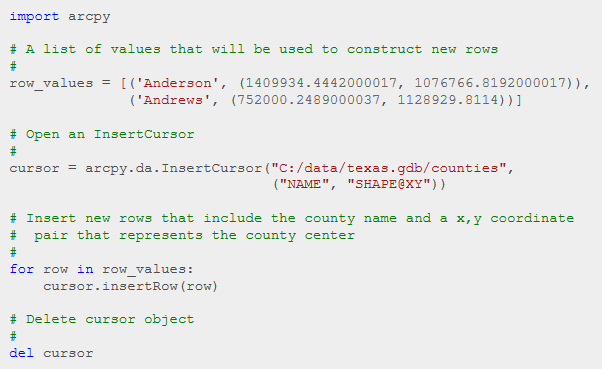
Could you walk me through adding a point to that feature class based upon an XY value, or decimal degree values? I trying to use this sample code, and edit it to fit my script, but I've got some questions about it.
1. Does the 'counties' feature class already have fields called "NAME" and "SHAPE@XY"? I understand how to add a field called "NAME", but I don't understand how to add a special field that ArcMap will know to plot the point from.
2. I'm assuming that the "SHAPE@XY" token is used to plot the point at the XY coordinates, but I don't understand how tokens work?
3. What parameters are acceptable for cursor.insertRow()? Do I need to loop through a list? That seems unnessecary because I only need one point.
4. Is it possible to plot the point based on decimal degrees?
import arcpy
# A list of values that will be used to construct new rows
#
row_values = [('Anderson', (1409934.4442000017, 1076766.8192000017)),
('Andrews', (752000.2489000037, 1128929.8114))]
# Open an InsertCursor
#
cursor = arcpy.da.InsertCursor("C:/data/texas.gdb/counties",
("NAME", "SHAPE@XY"))
# Insert new rows that include the county name and a x,y coordinate
# pair that represents the county center
#
for row in row_values:
cursor.insertRow(row)
# Delete cursor object
#
del cursor
Also, is it possible to take user input directly from the Python window in ArcMap?
Thank you for bearing with me, I'm about as green as they come in Python 🙂
I've decided to start with taking user input of the coordinates, and then plotting the point from there. Making an add-in seems more difficult, so I think I'll work up to it.
I have figured out how to create my point feature class and take X and Y input from the user.
Could you walk me through adding a point to that feature class based upon an XY value, or decimal degree values? I trying to use this sample code, and edit it to fit my script, but I've got some questions about it.
1. Does the 'counties' feature class already have fields called "NAME" and "SHAPE@XY"? I understand how to add a field called "NAME", but I don't understand how to add a special field that ArcMap will know to plot the point from.
2. I'm assuming that the "SHAPE@XY" token is used to plot the point at the XY coordinates, but I don't understand how tokens work?
3. What parameters are acceptable for cursor.insertRow()? Do I need to loop through a list? That seems unnessecary because I only need one point.
4. Is it possible to plot the point based on decimal degrees?
import arcpy
# A list of values that will be used to construct new rows
#
row_values = [('Anderson', (1409934.4442000017, 1076766.8192000017)),
('Andrews', (752000.2489000037, 1128929.8114))]
# Open an InsertCursor
#
cursor = arcpy.da.InsertCursor("C:/data/texas.gdb/counties",
("NAME", "SHAPE@XY"))
# Insert new rows that include the county name and a x,y coordinate
# pair that represents the county center
#
for row in row_values:
cursor.insertRow(row)
# Delete cursor object
#
del cursor
Also, is it possible to take user input directly from the Python window in ArcMap?
Thank you for bearing with me, I'm about as green as they come in Python 🙂
01-20-2014
05:10 PM
- Mark as New
- Bookmark
- Subscribe
- Mute
- Subscribe to RSS Feed
- Permalink
Hi Carly,
please note, the example provided by Josh is for arcmap 10.1 or 10.2 only. If you are on version 10.0, you will need to use this: http://help.arcgis.com/en/arcgisdesktop/10.0/help../index.html#//000v00000038000000. There is slightly different syntax between the arcpy.da.InsertCursor (10.1), and the arcpy.InsertCursor (10.0, no da). I am not very familiar with 10.0 insert cursors, so I'm sorry if you are using 10.0.
in answer to your questions:
1. The Counties feature class would need to have a field called "NAME" in that example. The "SHAPE@XY" thing is referring to the shape field. Which all feature classes have by default. From the syntax in that example, we are able to tell that the "counties" feature class is a point feature class, because it simply uses a tuple in the form of (x, y). We'll save lines or polygons for another time 😉
2. "SHAPE@XY" usually refers to the centroid. But i think because it is a point feature, this is the same as the coordinates of the point.
3. When using the insert cursor, it is not necessary to call all of the fields, only the fields you wish to change the value of. In the example, the counties feature class could have more fields than listed, but they are only updating the "name" field, and the shape, so these are the ones that were called. So if you only want to plot a point, no attributes, you could just list ("SHAPE@XY") as the second parameter. Then below where it says c.insertRow(row), you could simply put "c.insertRow((x, y))". The double brackets is because the (x,y) needs to be a tuple.
4. yes. You just need to set your coordinate system of your layer as decimal degrees.
-----
Now, in regards to user input by clicking, I have tried doing this sort of thing before.
May I suggest you use a "feature set" - http://resources.arcgis.com/en/help/main/10.1/index.html#/A_quick_tour_of_using_Feature_Set_and_Reco...
This is set up in model builder (and then you can export from model builder to python script if you want to do it that way).
-Open model builder, and drag the buffer tool into it from toolbox.
-Right-click anywhere in a model and choose Create Variable.
-Scroll down the list and choose Feature Set
-connect the feature set to the buffer tool and set it as input
I believe there are additional steps, like needing to export it as a tool, but this should get you started.