- Home
- :
- All Communities
- :
- Developers
- :
- Python
- :
- Python Questions
- :
- 10.1 List in Value Table in Python Toolbox
- Subscribe to RSS Feed
- Mark Topic as New
- Mark Topic as Read
- Float this Topic for Current User
- Bookmark
- Subscribe
- Mute
- Printer Friendly Page
10.1 List in Value Table in Python Toolbox
- Mark as New
- Bookmark
- Subscribe
- Mute
- Subscribe to RSS Feed
- Permalink
- Mark as New
- Bookmark
- Subscribe
- Mute
- Subscribe to RSS Feed
- Permalink
I know this is an old post, but I have been struggling with this as well and wanted to post a solution. I was able to figure out a very clunky workaround that does allow you to create your own drop down. In my case, I did not actually use a "Field" value for the first part of the drop down but rather a list of Land use values derived from an input table's field values.
By using suggestions from David Wynne above, I was able to "trick" the GP framework with a Python toolbox. I made a copy of the Summary Statistics parameter as suggested, then modified the parameter filter lists like this:
parameters[7].filters[1].list = ['some_list', ...]
And the relevant code:
# global var
CURVE_NUMS = [[u'Agricultural', 30.0, 58.0, 71.0, 80.0, 30.0], ...]# more values ommitted

    def getParameterInfo(self):
         fmap = arcpy.GetParameterInfo("Statistics_analysis")[2]

    def updateParameters(self, parameters):
        """Modify the values and properties of parameters before internal
        validation is performed.  This method is called whenever a parameter
        has been changed."""
        if parameters[4].value:
            if parameters[4].valueAsText != LULC_FIELD and not parameters[6].altered:
                setattr(sys.modules[__name__], LULC_FIELD, parameters[4].valueAsText)

                with arcpy.da.SearchCursor(parameters[3].valueAsText, [parameters[4].valueAsText]) as srows:
                    lulc_vals = sorted(list(set([str(r[0]) for r in srows]))) # get land use values from field

                parameters[6].values = CURVE_NUMS

                # create dummy table
                parameters[7].value = [[l, ' '] for l in lulc_vals]  #assign a default of " " so the user can fill in drop down
                parameters[7].filters[1].list = [r[0] for r in CURVE_NUMS]  # IMPORTANT, update the filter list from summary stats to your own list


        return
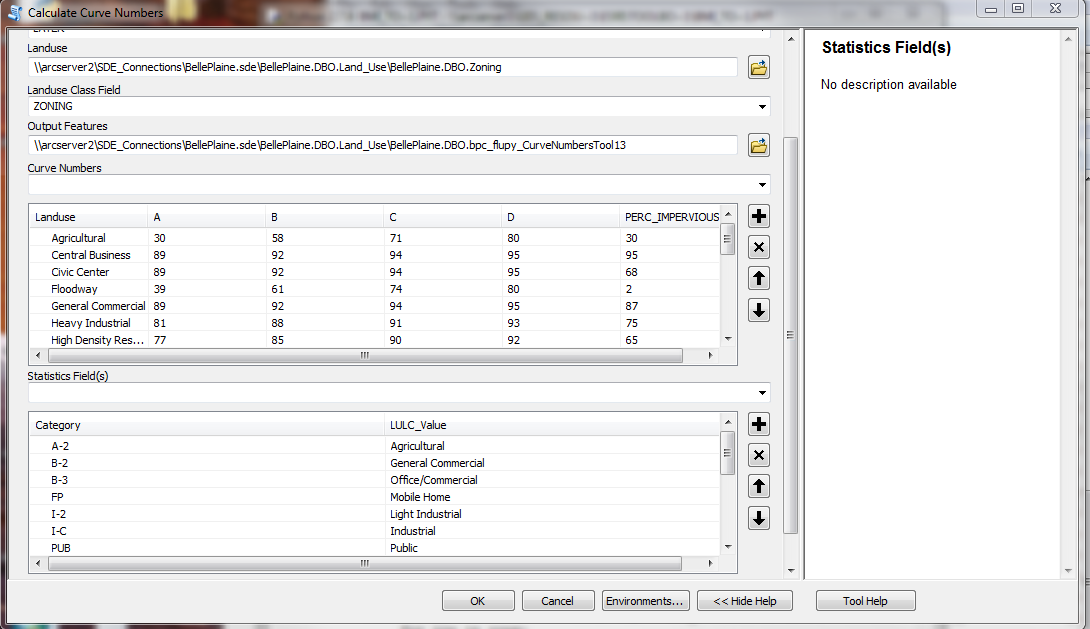
And the drop down:
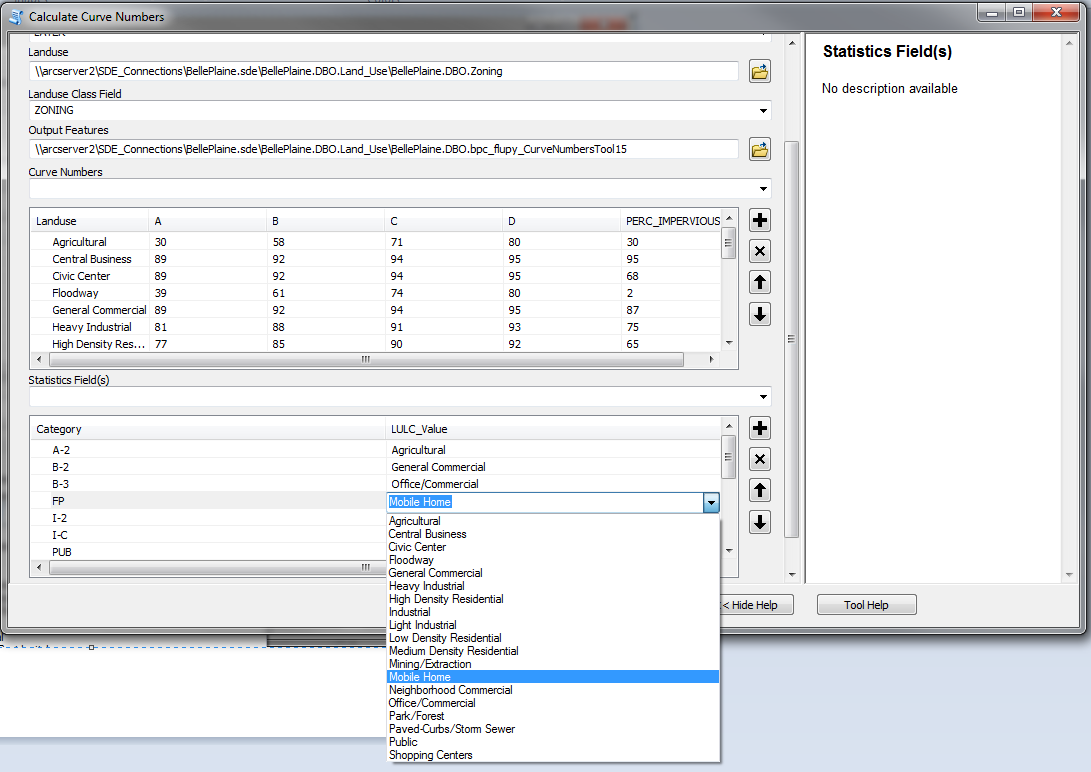
This is not customizable, as you can only use the two columns and you cannot rename the parameter, but it does work. Hopefully Esri supports this behavior in the future.
It would be nice if you could set a list filter for multiple columns like this:
parameters.filter.list = [[list1,...], [list2]]
- Mark as New
- Bookmark
- Subscribe
- Mute
- Subscribe to RSS Feed
- Permalink
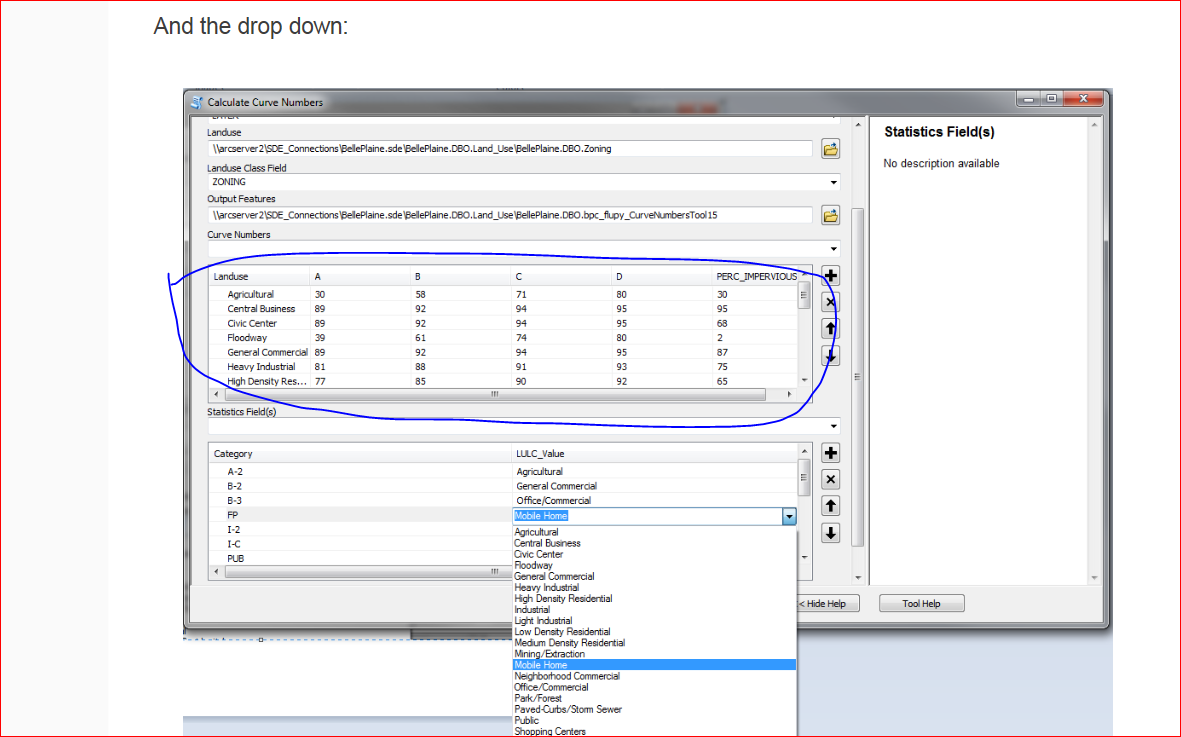
Could you tell me how to make a parameter like this as I circled as below? I need to a parameter can be used to show a table content? Thanks.
- Mark as New
- Bookmark
- Subscribe
- Mute
- Subscribe to RSS Feed
- Permalink
This supported at 10.3 and later.
Defining parameters in a Python toolbox—Help | ArcGIS for Desktop : Creating value table parameters
- « Previous
-
- 1
- 2
- Next »
- « Previous
-
- 1
- 2
- Next »