- Home
- :
- All Communities
- :
- Industries
- :
- Public Safety
- :
- Public Safety Questions
- :
- Re: Is it possible to divide a raster into equal p...
- Subscribe to RSS Feed
- Mark Topic as New
- Mark Topic as Read
- Float this Topic for Current User
- Bookmark
- Subscribe
- Mute
- Printer Friendly Page
Is it possible to divide a raster into equal parts based off the sum of its cells?
- Mark as New
- Bookmark
- Subscribe
- Mute
- Subscribe to RSS Feed
- Permalink
I'm working on a project to redraw district boundaries for our police department to help spread the work load more evenly among officers.
I created a raster layer showing overall time spent on calls across the city and was wondering if there is a way to divide the layer into equal value amounts rather than equal areas.
We have 4 districts and I'd like to divide my raster so that the amount of time (sum of the cells) is equally split. The boundaries have been arbitrarily drawn throughout the years as new areas where annexed so completely redrawing the district lines is not a problem.
Any ideas on how to approach this or am I hoping for too much?
- Mark as New
- Bookmark
- Subscribe
- Mute
- Subscribe to RSS Feed
- Permalink
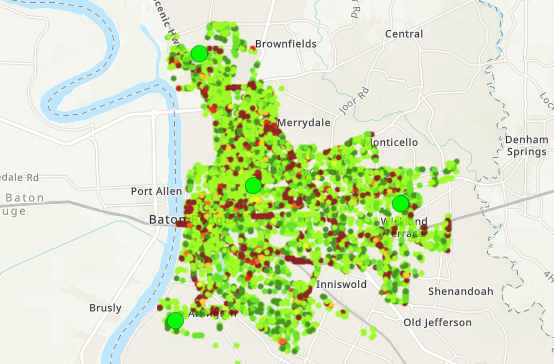
Just thought of another alternative to do this calculation by using location - allocation in ArcGIS Online (or using Network Analyst in Desktop). See below the description (with Spanish interface, sorry) of how to do this in ArcGIS Online:
Now before you start, you should publish the 4 locations and the demand point (raster values) to ArcGIS Online. Note that ArcGIS Online is limited to 10.000 demand points to be included in the analysis. I reduced the points filtering out the lowest grid_code values reducing the 16.000 points to a little over 6.000 points.
In ArcGIS Online, load the layers a a new map:
Switch on analysis and select "Choose best facilities:
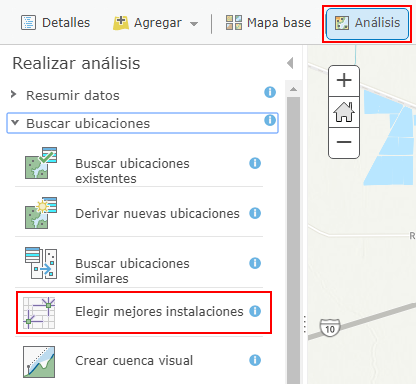
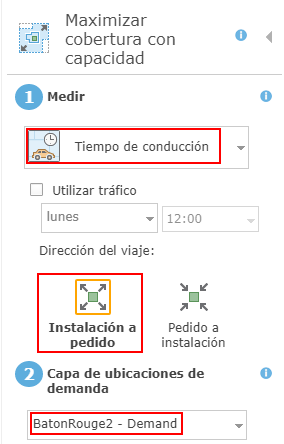
Next choose "Maximize coverage with capacity":

Then specify the way you want to assign the demand to the facilities (in this case drive time), select the option installations to demand and select the demand layer which are the raster points with the grid_code:
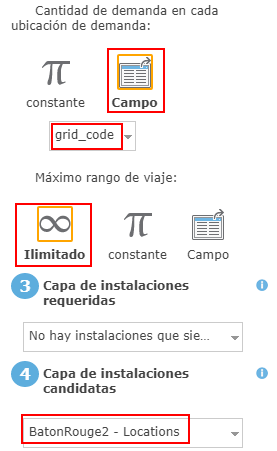
Next you will have to select "Field" and the field "grid_code" in de demand layer, to use the time value for assigning the demand per point. Also indicate that the drive range is unlimited or specify a valid value. Make sure that the layer with the 4 locations is selected at number 4:
Before the next stop, you will have to indicate the maximum demand for each of the 4 locations. This you need to defined based on the statistics of the grid_code field. See below the stats (values ranging from 2 to 10 and the sum is 31235):
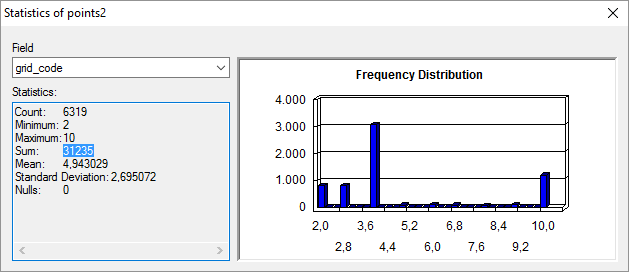
The value 31235 is the total demand. You should divide this by 4 (4 locations) and add the maximum value of the range to it as security to not keep any demand point out (±7820). Specify that at number 4 as constant capacity and you are ready to do the analysis:
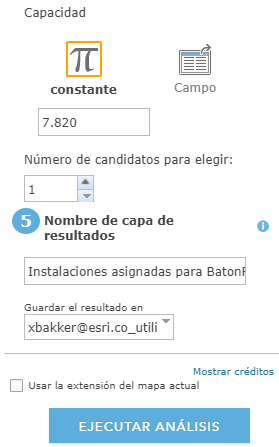
Always click on the link "show credits" te review the number of credits this operation will consume. It will be the number of demand points divided by 10:

I did not execute the operation, since I didn't want to consume 631.9 credits just to see if this works... So no guarantees at this point that the desired result is actually created.
Will try with a much smaller dataset and check in later to share the result.
- Mark as New
- Bookmark
- Subscribe
- Mute
- Subscribe to RSS Feed
- Permalink
So I did a small test with about 500 demand points, filtering in Desktop the points by "grid_code > 4 AND Mod(OBJECTID, 10) = 0" and published that layer as service:
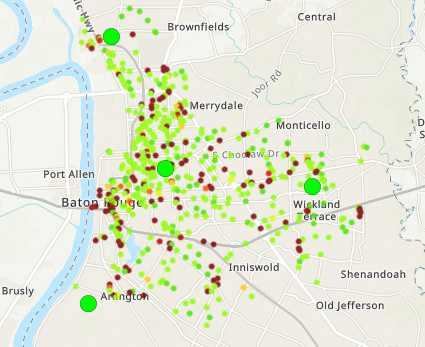
And did the process. However, for some reason it only processed one candidate and assigned about 132 demand points, which also had a strange logic applied:
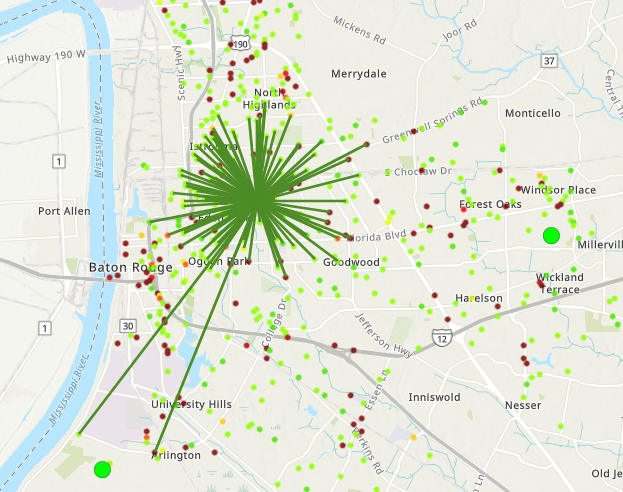
I guess it's back to the drawing board...
- Mark as New
- Bookmark
- Subscribe
- Mute
- Subscribe to RSS Feed
- Permalink
Today I ran in to a tool that was mentioned at another thread called "Allocation Tools for ArcGIS" shared by a user called "deelesh": http://www.arcgis.com/home/item.html?id=c5ae481f25604d1bb050d9bd1d6e3c06 which allows for location allocation using an open source Linear Programming (LP) solver called COIN.
So I thought I had a go at it, but it requires a network dataset. Since I don't have one, I thought I could create something similar using the Spanning Tree Tools created by Dan Patterson and which you can download here: https://www.arcgis.com/home/item.html?id=6ce9db93533345e49350d30a07fc913a
I ran the Spanning Tree tool on my demand points (a simplified set) and this was the result:
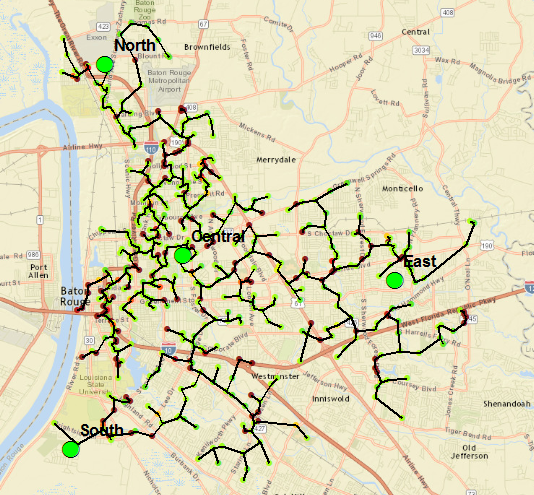
Then I turned it into a network and used it in the location allocation tool:
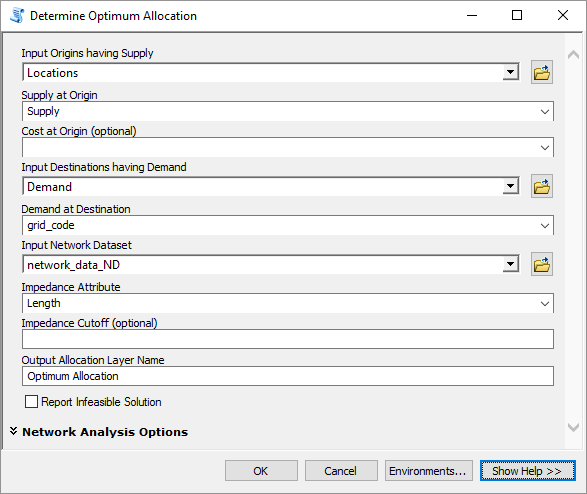
And this is the result:
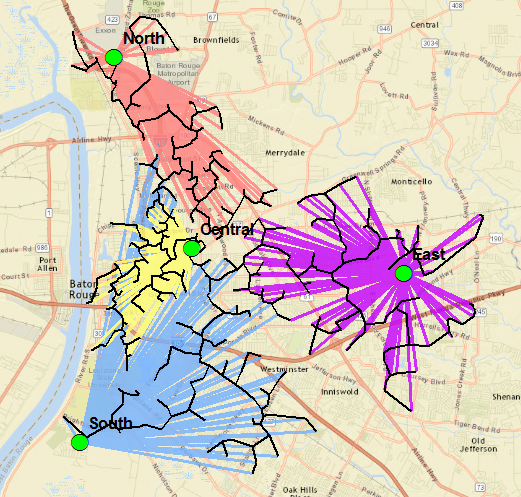
Still not perfect, but we are getting somewhere...
- Mark as New
- Bookmark
- Subscribe
- Mute
- Subscribe to RSS Feed
- Permalink
Cool! Looks good!
- Mark as New
- Bookmark
- Subscribe
- Mute
- Subscribe to RSS Feed
- Permalink
Since it looked cool as Dan mentioned, I thought that I would do another test, creating the network using Dan's tool but now on all the nearly 16.000 points and create the network. This is a detail of how that looks like:
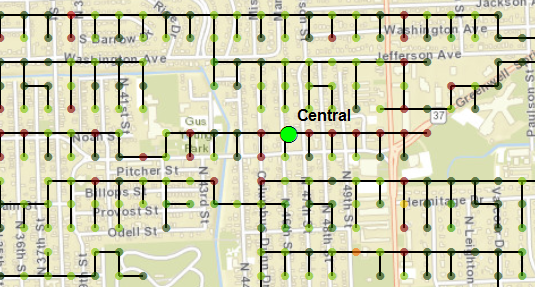
... I did the analysis on the entire set:
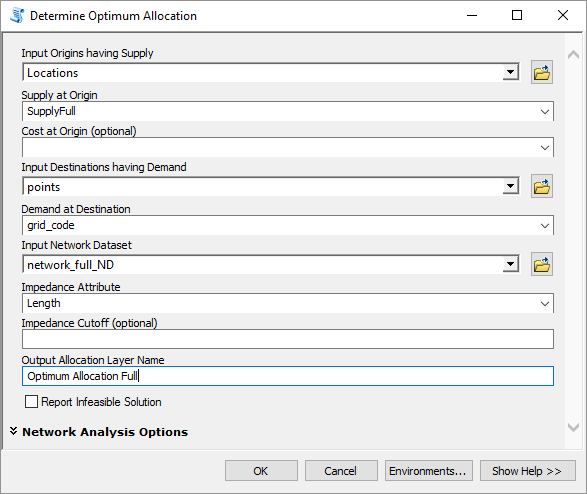
Which resulted in something that actually makes sense:
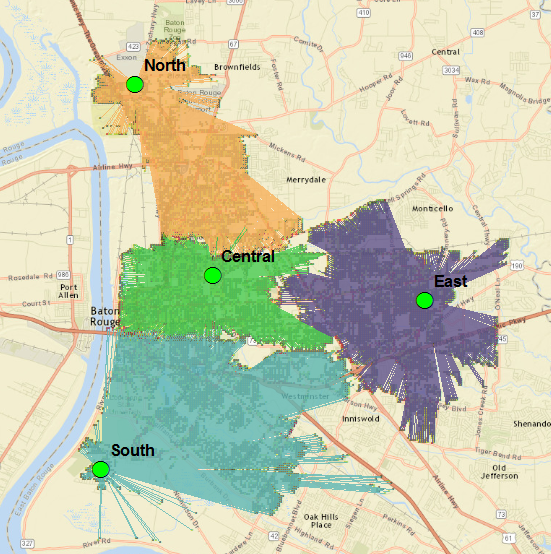
There may still be some manual adjustments required, but for now it seems to be an acceptable result.
- Mark as New
- Bookmark
- Subscribe
- Mute
- Subscribe to RSS Feed
- Permalink
Excellent MST has purpose ! A big bookmark on this
- Mark as New
- Bookmark
- Subscribe
- Mute
- Subscribe to RSS Feed
- Permalink
It is a great tool Dan, thanks for sharing and especially in my line of work (utilities) the tool can be used in many different planing and design activities.
- Mark as New
- Bookmark
- Subscribe
- Mute
- Subscribe to RSS Feed
- Permalink
given me the goal to implement weighted MST over the holidays ![]()
- Mark as New
- Bookmark
- Subscribe
- Mute
- Subscribe to RSS Feed
- Permalink
Xander,
Sorry, I had a long weekend for Veteran's Day.
This looks great! I'm going to try running through this process first thing this morning.
Thanks for all the help. I'll let you know what I come up with.
- Mark as New
- Bookmark
- Subscribe
- Mute
- Subscribe to RSS Feed
- Permalink
Great! It will be very interesting to see what results you get...