Hello all! I've attached a screenshot of my working model. I'm hoping that I'm not way off on this one but I know for sure that a few sections need to be cleaned up or automated.
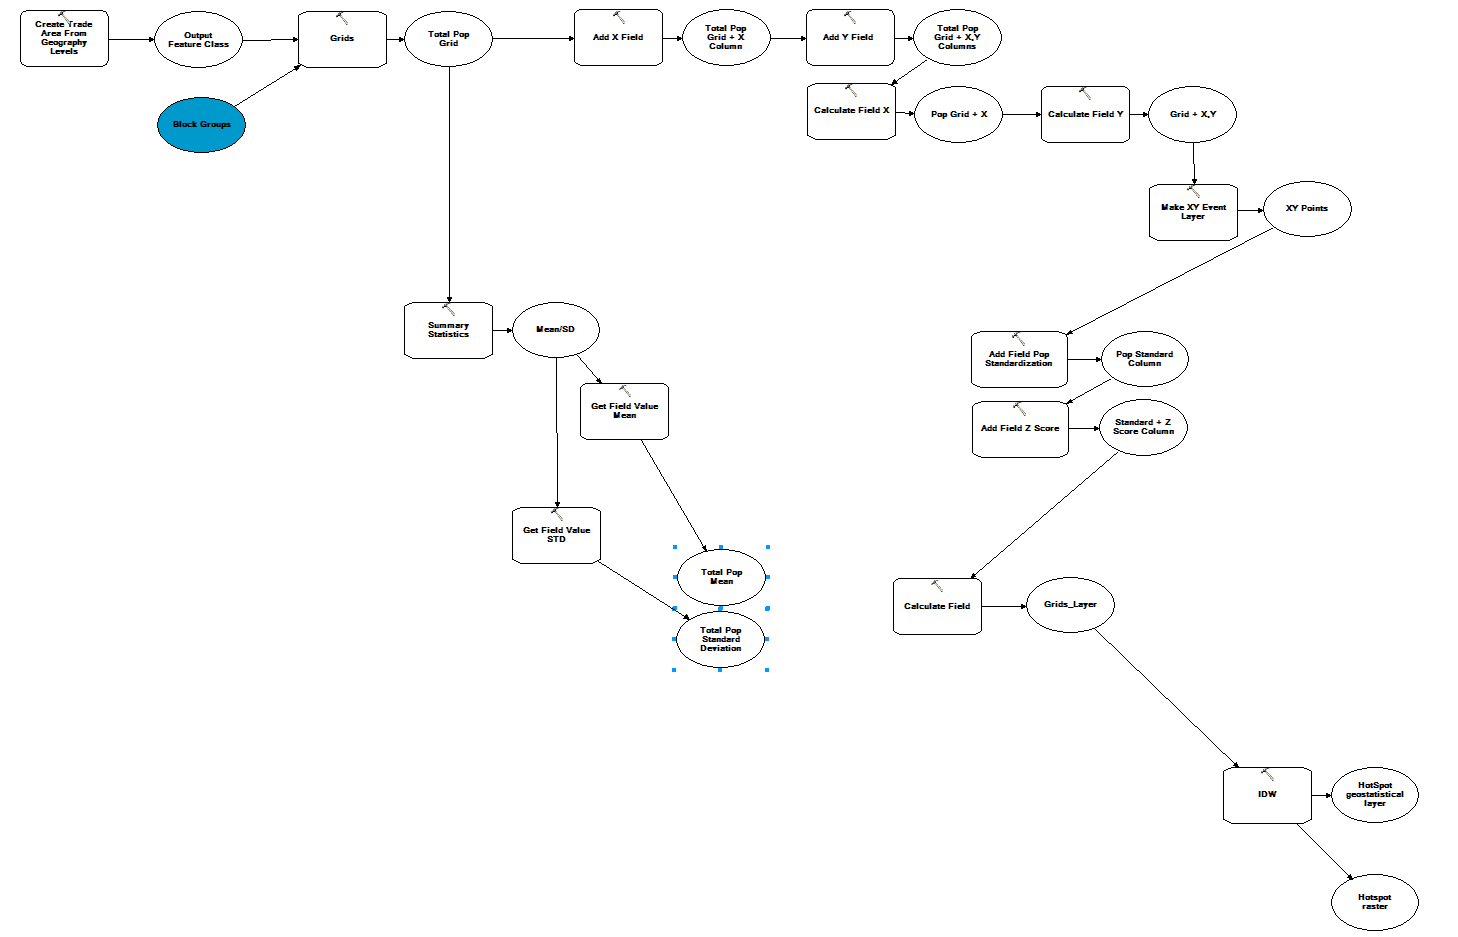
Essentially what I am trying to do is:
- Create a grid over a specified geometry that captures demographic information like total population and density. Grids
- Calculate means and standard deviation for each demographic variable for use later. Summary Statistics
- Calculate the geometric center of the grids and convert the grid to points. Calculate Field/Make XY Event Layer
- Add standardization fields for each variable and a zscore field. Add Field
- Use means and standard deviations to calculate standardization for each point and ultimately a Zscore. Calculate Field
- Use the Zscore to create a hotspot raster. IDW
Here are my questions:
- How can I use multiple summary statistics as variables in the calculate field tool (sometimes up to 30 variables)?
- Sometimes only 1 variable will be used when creating a grid but other times 30+ variables will be used. Is there a simple way to add the same number of columns with the Add Field tool as variables specified in the Grid tool?
- As an example: I've specified population, household income and median age as my 3 variables. I'll need to add an extra standardization column for each and a zscore column. Is there any easier way than copying/pasting the Add Field tool 3 times?
- Same question about automation goes for calculating the mean/sd and calculating standardization scores and Zscores for each. Iterator?
Any help is greatly appreciated! If any of this is not clear do not hesitate to ask for clarification. I know this is rather complicated to explain but my main issue is how to utilize multiple summary statistic variables to calculate standardization scores and automate field adding/calculating.