Turn on suggestions
Auto-suggest helps you quickly narrow down your search results by suggesting possible matches as you type.
Cancel
- Home
- :
- All Communities
- :
- Products
- :
- Mapping
- :
- Mapping Questions
- :
- Showing the values in grids
Options
- Subscribe to RSS Feed
- Mark Topic as New
- Mark Topic as Read
- Float this Topic for Current User
- Bookmark
- Subscribe
- Mute
- Printer Friendly Page
Showing the values in grids
Subscribe
4491
11
08-23-2016 10:12 AM
08-23-2016
10:12 AM
- Mark as New
- Bookmark
- Subscribe
- Mute
- Subscribe to RSS Feed
- Permalink
Hi everyone,
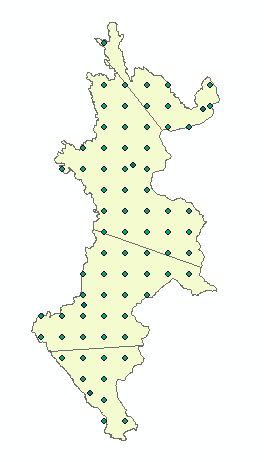
I have my Rainfall data on points as shown in the following diagram.
I want them to be show in 3km X 3km grids as shown the following diagram.

I also want the values in these grids as shown in the above, (ie - in regular interval like 0-10, 10-20 ) and the area percentage of these values.
Can you please say me what tool I have to use and how to use them.
Any help is highly appreciable.
11 Replies
08-25-2016
11:15 AM
- Mark as New
- Bookmark
- Subscribe
- Mute
- Subscribe to RSS Feed
- Permalink
Oh really sorry about it Dan.
You was greatly helpful. Thank you very much.
08-24-2016
12:42 AM
- Mark as New
- Bookmark
- Subscribe
- Mute
- Subscribe to RSS Feed
- Permalink
if you want a projected raster, you could do the projection first using the Project—Help | ArcGIS for Desktop tool
Alternately you can use the Project Raster—Help | ArcGIS for Desktop tool on the raster.
My preference would be the first option
- « Previous
-
- 1
- 2
- Next »
- « Previous
-
- 1
- 2
- Next »