- Home
- :
- All Communities
- :
- Products
- :
- Mapping
- :
- Mapping Questions
- :
- Rotate/Scale Polylines Based on Field in Attribute...
- Subscribe to RSS Feed
- Mark Topic as New
- Mark Topic as Read
- Float this Topic for Current User
- Bookmark
- Subscribe
- Mute
- Printer Friendly Page
Rotate/Scale Polylines Based on Field in Attribute Table
- Mark as New
- Bookmark
- Subscribe
- Mute
- Subscribe to RSS Feed
- Permalink
Does anyone know a way or have a script that allows you to rotate and/or scale a polyline based on a field in the attribute table. I know you can do this with the editor, but I have about 1200 different lines that need to be rotated and scaled and all to different angles and sizes (based on the angle) that will be defined by a field in the attribute table. I am working with 3D polylines and have an advanced license for ArcGIS 10.2.2.
- Mark as New
- Bookmark
- Subscribe
- Mute
- Subscribe to RSS Feed
- Permalink
Visually there are few lines, but each line consist of many features. I guess that is what you were referring to with "section". Angle is not provided yet... in what unit are the angles provided? Degrees? Are the angles geographic or arithmetic?
What would be the field to hold the "scale" value?
I'm still a little confused, if the sections (features) that make up a line are applied different scaling and rotation, the polyline (combination of the sections) will not make much sense (I think). What is the purpose of this process?
- Mark as New
- Bookmark
- Subscribe
- Mute
- Subscribe to RSS Feed
- Permalink
Yes, so I realized after you replied here that I have recently densified the lines every 10 meters for a specific purpose. The "sections" that I am talking about are the sections that are defined by a single "span ID".
You are correct that if I scale and rotate these differently that the lines will no longer be connected. My end goal is to create a layer that is defined by the flight angle of birds across each power line span. The picture below is one span that I manually edited. This is what I want to happen for all of the spans in my dataset. The rotation is based on flight direction of birds and scaling occurs so that the new flight path does not exeed the length of the original span.
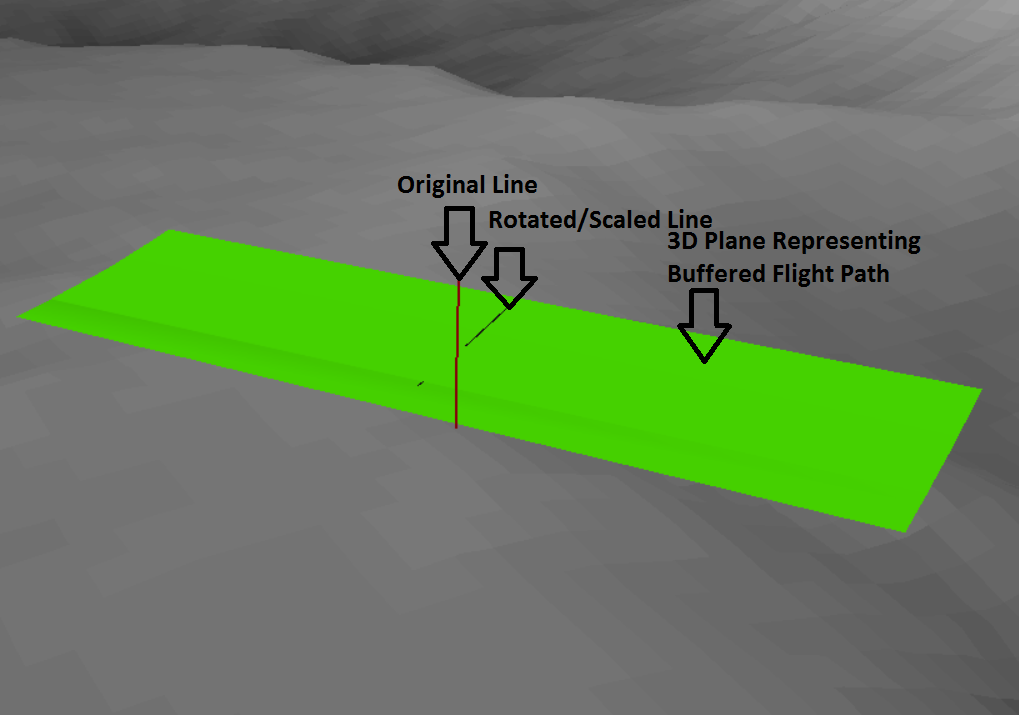
Hopefully this helps explain my goals a little more clearly. I feel like it is a pretty unique problem so its hard to explain exactly what I need!
- Mark as New
- Bookmark
- Subscribe
- Mute
- Subscribe to RSS Feed
- Permalink
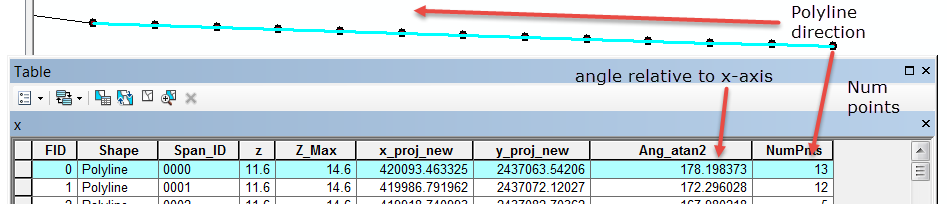
The data are indeed segments many points for some bizarre reason since they appear to form straight line segments.
I calculated angle relative to the x-axis using
Python interpreter
expression box:
polyline_angle(!Shape!)
''' input shape field: returns angle relative to x-axis using the first and last point
polyline_angle(!Shape!)    #enter into the expression box'''
import math
def polyline_angle(shape):
  radian = math.atan2((shape.lastPoint.Y - shape.firstPoint.Y),(shape.lastPoint.X - shape.firstPoint.X))
  degrees = math.degrees(radian)
  return degrees
I calculated the number of points using
Python
Expression:
count_pnts(!Shape!)
''' input shape field, return number of points in a feature
count_pnts(!Shape!)    #enter into the expression box'''
def count_pnts(shape):
  counter = 0
  num_parts = shape.partCount
  num_pnts = 0
  while counter < num_parts:
    part = shape.getPart(counter)
    pnt = part.next()
    while pnt:
      num_pnts += 1
      pnt = part.next()
      if not pnt:
        pnt = part.next()
    counter += 1
  return num_pnts
For example your feature FID 1, Span 000 consists of 13 points ( use the FeatureVerticesToPoints tool ) so this file for some reason has densified points along each segment. No clue how it was generated, but my guess is that the angles that I calculated apply to each of your little tiny segments and under no circumstances should you explode them. You can generalize the data within each segment ... you could try the Simplify Line tool to get rid of those excessive fiddly-bits. So in short...I would find out how those lines were generated and why before you get too far on the rotation stuff. If you want to rotate all the shapes by some amount then that is simple...if features have to be rotated by different amounts, then you do realize that they will in all likelihood not be connected any more.
Have fun
- Mark as New
- Bookmark
- Subscribe
- Mute
- Subscribe to RSS Feed
- Permalink
Sorry I forgot to include an image for the first feature
- Mark as New
- Bookmark
- Subscribe
- Mute
- Subscribe to RSS Feed
- Permalink
I just replied above to Xander Bakker with some information that is relevant to your concerns. So you see in the attribute table that there is a span ID that covers that whole section. Those are the 'sections' that I am trying to rotate (the whole section represented by 1 span ID). The multiple points in there are because I had to densify the lines by 10 meters for another process. I have provided here a new dataset that has not been densified if you want to play around with it. But yes, I do realize they won'te be connected anymore and that is ok for what I am trying to do. Refer to my reply to Xander for a picture of my end goal.
Thanks!
- Mark as New
- Bookmark
- Subscribe
- Mute
- Subscribe to RSS Feed
- Permalink
Ahhh Ok, that does clarify the problem...I will revisit in light of the new information. The only question that remains is do you want the rotation to occur about the center point? the start point or the end point? One of the points needs to be fixed during the rotation process....think about it
- Mark as New
- Bookmark
- Subscribe
- Mute
- Subscribe to RSS Feed
- Permalink
Yea, I think it would be best if it rotated around the center point. I wish I had the rotation angles and scale changes that will need to happen to show you too, but unfortunately that is out of my hands! Thanks for taking such an interest in this question!
- Mark as New
- Bookmark
- Subscribe
- Mute
- Subscribe to RSS Feed
- Permalink
This is what I am thinking... it currently is a demonstration so if Xander, or anyone else wants to make it work with your shapefiles, then the principles might be useful.
For the demo, all it does is take a line, takes the first and last points and ignores the rest(ish). performs a translation to the origin, a rotation by a certain angle, and scales the x axis by a factor of 2x. The only real input parameters needed are provided in the documentation and you can see alternates after the if __name__ section of the script.
I can't get back to this for a day or 2, but this may keep you or others busy until you get your rotation data. bear in mind, this can be greatly expanded, but I wanted to demonstrate what an affine transformation was. I was as verbose as possible and didn't bury the code in one-liners since I teach and I hate unwrapping those for students so they can understand.
So have fun and give me some feedback via here or if it is more verbose...email etc.
Dan
'''
affine_line.py
Author: [email protected]
Purpose: a one-off script to rotate a line about its center
         ... aka ... a 2 point polyline
Requires:
  import numpy as np  either in the script or in 'rotate'
Namespace:
  line    2 point line
  angle   rotation angle in degrees
  x=2,y=1 scaling in the x and/or y directions
  XY_c, XY_t, XY_r, XY_s
     namespace representing center, translated, rotated, scaled pnts
'''
import numpy as np
np.set_printoptions(precision=2,threshold=20,edgeitems=3,suppress=True,linewidth=60)  # set default print options
def array_check(pnts):
  '''check to see if the pnts are expressed as an array'''
  bool = type(line).__module__ == np.__name__
  if not bool: #not an array
    pnts = np.array(pnts,dtype='float64')
  return pnts
def angle(pnts):
  '''angle between first and last points in array format'''
  pnts = array_check(pnts)
  dx,dy = pnts[0] - pnts[-1]
  deg = np.rad2deg(np.arctan2(dx,dy))
  return deg
def center(pnts):
  '''average x, y coordinate for points'''
  pnts = array_check(pnts)
  XY_c = np.mean(pnts,axis=0)
  return XY_c
def distance(pnts):
  '''returns the length/distance between the first and last points'''
  pnts = array_check(pnts)
  dx,dy = pnts[0] - pnts[-1]
  return np.hypot(dx,dy)
def translate(pnts, XY_c=None):
  '''translate a point(s)'''
  if XY_c == None:
    XY_c = center(pnts)
  XY_t = pnts - XY_c
  return XY_t
def rotate(pnts,angle):
  '''rotate points about the origin, given an angle in degrees,
    (-ve counterclockwise, +ve for clockwise'''
  angle = np.deg2rad(angle)
  s = np.sin(angle)
  c = np.cos(angle)
  aff_matrix = np.array([[c, -s],[s, c]])
  XY_r = np.dot(pnts, aff_matrix)
  return XY_r
def scale(pnts, x=1, y=1):
  '''returns the points scaled by x and y for the x and y direction'''
  XY_s = np.multiply(pnts, [x,y])
  return XY_s

if __name__ == '__main__':
  '''read the header...a verbose demonstration follows'''
  line = [[0.0,0.0],[1.0,1.0]]  # line as a sequence of points
  angle = -45.0                 # angle to rotate in degrees
  x = 2.0; y = 1                # scaling in x and y directions
  XY_c = center(line)           # center(line)
  XY_t = translate(line, XY_c)  # translate(line, center(line))
  XY_r = rotate(XY_t,angle)     # rotate(translate(line, center(line)), angle)
  XY_s = scale(XY_r,x=2, y=1)   # scale(rotate(translate(line, center(line)), angle), x=2, y=1)
  print '\n','-'*60
  print __doc__
  print('Input line (pnts):\n {}'.format(line))
  print('Center point:\n {}'.format(XY_c))
  print('Translate to center:\n {}'.format(XY_t))
  print('Rotate about center:\n {}'.format(XY_r))
  print('Scaled with x=2,y=1:\n {}'.format(XY_s))
  print('Rotate back:\n {}'.format( rotate(XY_s,-angle) ))
  print('Translate back:\n {}'.format( translate(rotate(XY_s,-angle),-XY_c) ))
  print '\n','-'*60
- Mark as New
- Bookmark
- Subscribe
- Mute
- Subscribe to RSS Feed
- Permalink
Dan Patterson, thank you for that script, but unfortunately I have been in the field for a little while and haven't been able to look at this and about to take about a month of leave. When I get back from leave I will play around with your method you posted here. Thanks for posting the demo and I will be sure to take a look!
- Mark as New
- Bookmark
- Subscribe
- Mute
- Subscribe to RSS Feed
- Permalink
Morgan... remember it is a demo script, demonstrating the principles, I will try to get something functional once I am done marking term projects. Be safe... Dan
- « Previous
-
- 1
- 2
- Next »
- « Previous
-
- 1
- 2
- Next »