- Home
- :
- All Communities
- :
- Products
- :
- Mapping
- :
- Mapping Questions
- :
- Raster Classified Values Not The Same As Stretched...
- Subscribe to RSS Feed
- Mark Topic as New
- Mark Topic as Read
- Float this Topic for Current User
- Bookmark
- Subscribe
- Mute
- Printer Friendly Page
Raster Classified Values Not The Same As Stretched Values, Why?
- Mark as New
- Bookmark
- Subscribe
- Mute
- Subscribe to RSS Feed
- Permalink
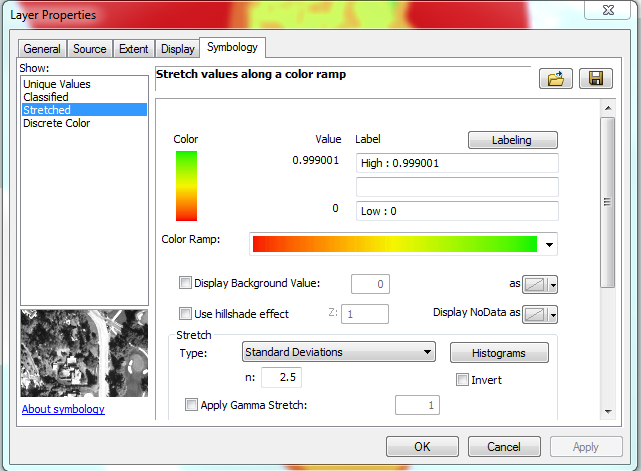
In my ArcMap project I have a grid. When displaying the grid with stretched values I see a range of 0 to (almost)1 like I would expect. See the first image below. I can use the identify tool to select pixels in the grid and the identify returns values from 0 to (almost) 1 as expected.
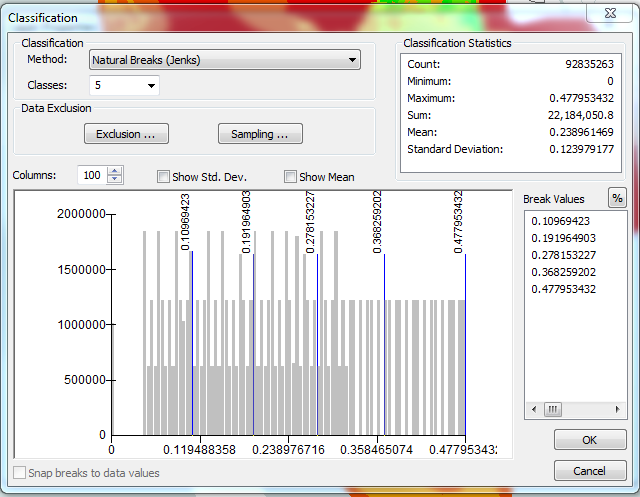
If I try to classify these data I am only allowed to classify values from 0 to 0.47 (see the second image below).
Why is there a difference between the stretched range and the classified range?
ArcGIS 10.1.2
- Mark as New
- Bookmark
- Subscribe
- Mute
- Subscribe to RSS Feed
- Permalink
Stretching the raster symbology doesn't change the underlying data, it simply is a visualization thing. If you want to produce a raster with new values to reflect this, you are going to have to decide upon the type of raster reclassification you want to use.
- Mark as New
- Bookmark
- Subscribe
- Mute
- Subscribe to RSS Feed
- Permalink
Dan,
Thanks for the reply. I am not trying to change the underlying data, just symbolize it in a different. In the grid layer properties I can see that the min and max values are between 0 and 1. My question is, when I try to symbolize those data by classes I see a different range of values. Why?
- Mark as New
- Bookmark
- Subscribe
- Mute
- Subscribe to RSS Feed
- Permalink
probably because the max value is rounded. 0.9990011 is almost 1.