- Home
- :
- All Communities
- :
- Products
- :
- Mapping
- :
- Mapping Questions
- :
- Re: I can't get graduated symbology on the attribu...
- Subscribe to RSS Feed
- Mark Topic as New
- Mark Topic as Read
- Float this Topic for Current User
- Bookmark
- Subscribe
- Mute
- Printer Friendly Page
I can't get graduated symbology on the attribute i want
- Mark as New
- Bookmark
- Subscribe
- Mute
- Subscribe to RSS Feed
- Permalink
I'm almost done with a humongous project except I'm just stalled on one certain point.
I want to cut and paste the screenshots of my work, but I can't do it on here. Can someone help me out via email?
I just have one problem, and I've gotten so far on my own.
My email's okonheim@comcast.net
Solved! Go to Solution.
- Mark as New
- Bookmark
- Subscribe
- Mute
- Subscribe to RSS Feed
- Permalink
the graduation should be green if it's negative and red if it's positive, so a negative vs positive change can be discerned.
Pick the color ramp you want in the layer properties:
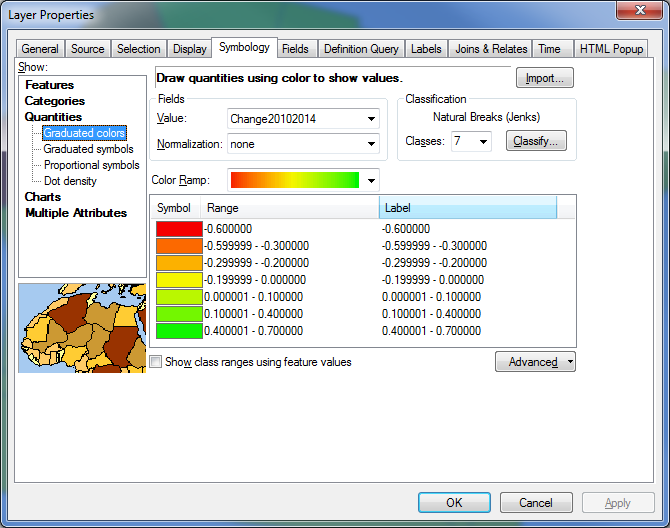
You can also double click on any color patch and change it manually to a different color.
Also a minor detail, but a state like Oklahoma should be on landscape view.
You can change the map to Landscape in File > Page and Print setup.
- Mark as New
- Bookmark
- Subscribe
- Mute
- Subscribe to RSS Feed
- Permalink
Thanks that helps a lot.
- Mark as New
- Bookmark
- Subscribe
- Mute
- Subscribe to RSS Feed
- Permalink
By the way, Orrin, if Owen, or anyone's comments are helpful to you, it is nice to go ahead and click the "helpful" yes button. 
- Mark as New
- Bookmark
- Subscribe
- Mute
- Subscribe to RSS Feed
- Permalink
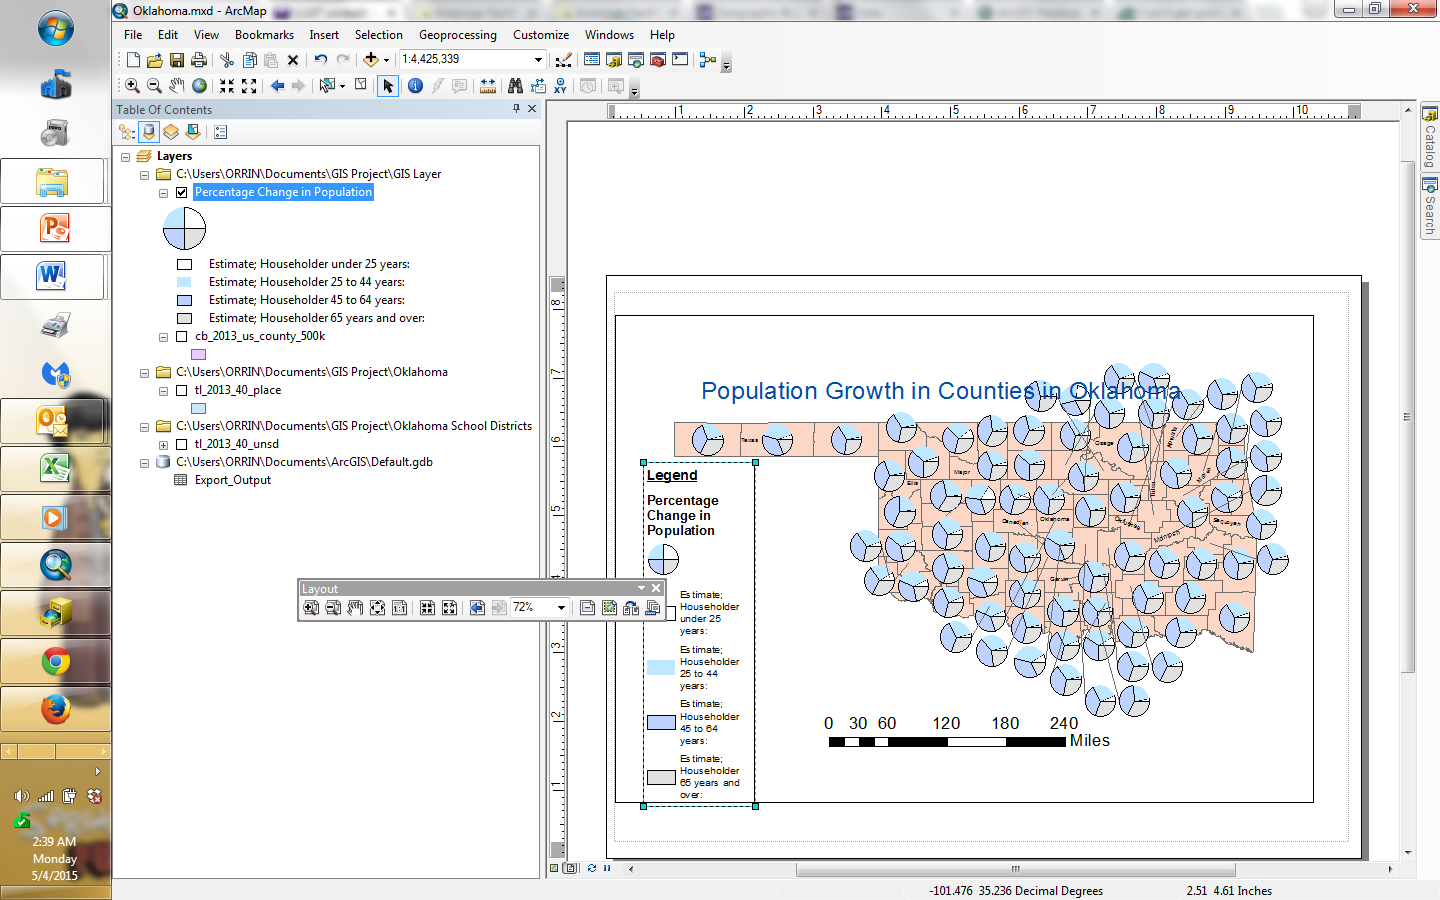
Yes, you've both been really helpful. I thanked you earlier, but definitely, lots of help. I seriously couldn't have done this without you. And this is truly a thrilling feeling to get back into the swing of doing this stuff.
My only problem now, is I wanted to put two variables on one map, but we have a problem here when I put the pie graphs up all the hard work with the graduated symbols disappeared.
- Mark as New
- Bookmark
- Subscribe
- Mute
- Subscribe to RSS Feed
- Permalink
Right, well that's why I said...
"ArcGIS Desktop . If it's in the same layer, then right click the layer in the table of contents, select copy, past it in to your table of contents, and then change the symbology of the copied layer as described in the help file."
If you copy your layer into the table of contents you can have classified symbology for one copy and pie chart symbology for the other.
- Mark as New
- Bookmark
- Subscribe
- Mute
- Subscribe to RSS Feed
- Permalink
OK, thanks so much again. Thanks but that tutorial didn't tell me how to do shading and pie graphs in the same visual. Rather than do a pie chart, I just calculated a percentage of homeowners per county that's 65 or older (the target demographic).
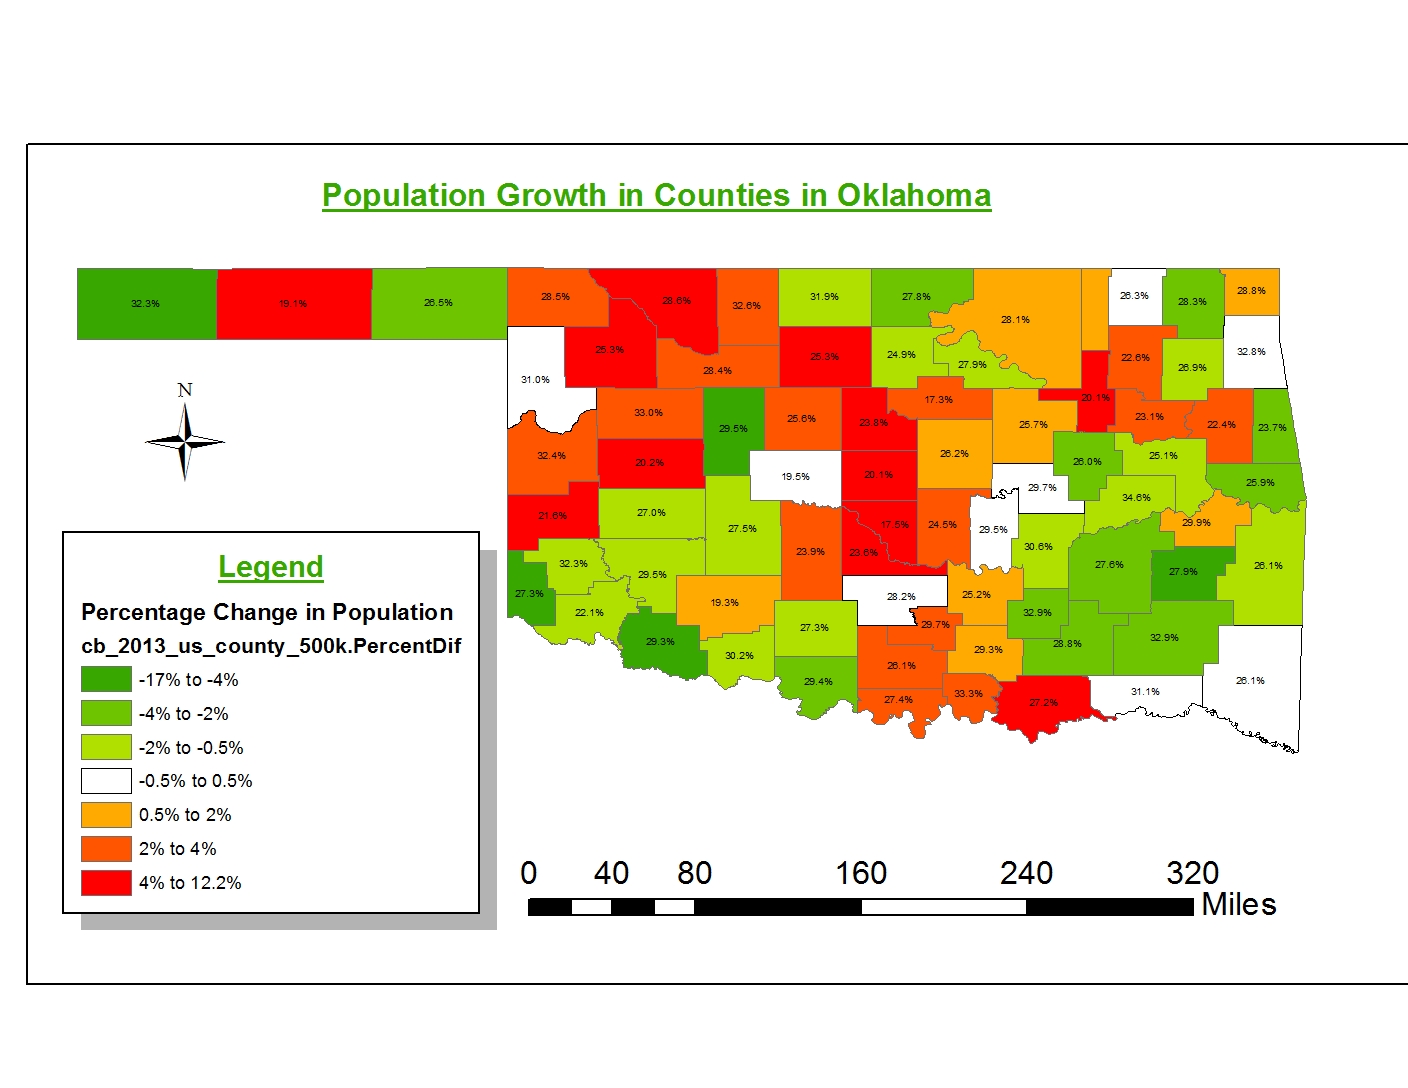
I think I finally have something respectable to show my boss but unfortunately it won't let me do county names AND percentages on the same map, so it's still kind of sloppy. I also don't know how to work that into the legend.
Lastly, I don't understand how to remove that line of text that says cb_2013_us_county_500k.PercentDif from the map legend.
I sold him on the idea that ArcGIS would make all our dreams come true, so this definitely should look convincing.
- Mark as New
- Bookmark
- Subscribe
- Mute
- Subscribe to RSS Feed
- Permalink
Orrin, I told you how to do what your asking: "right click the layer in the table of contents, select copy, past it in to your table of contents, and then change the symbology of the copied layer as described in the help file." I don't really know how else to describe it to you. Yes, you can have multiple attributes of one layer displayed by copying and pasting the layer again into the table of content and having different symbology for each copy. Of course you can have county names as well as percentages. The software is actually incredible versatile and powerful if you know how to use it.
- Mark as New
- Bookmark
- Subscribe
- Mute
- Subscribe to RSS Feed
- Permalink
Wow, that's genius. I would have never guessed that in a million years. How did you figure that out? It's certainly not in the manual.

- Mark as New
- Bookmark
- Subscribe
- Mute
- Subscribe to RSS Feed
- Permalink
Why does it all feel so small. I've reduced the size of the pies, but it still feels small to look at it. Is there a way to expand the canvas?.