- Home
- :
- All Communities
- :
- Products
- :
- Mapping
- :
- Mapping Questions
- :
- Colour maps files for imagery
- Subscribe to RSS Feed
- Mark Topic as New
- Mark Topic as Read
- Float this Topic for Current User
- Bookmark
- Subscribe
- Mute
- Printer Friendly Page
Colour maps files for imagery
- Mark as New
- Bookmark
- Subscribe
- Mute
- Subscribe to RSS Feed
- Permalink
Do colour map files (*.clr) actually really give you the true rgb values of the colour you see in ArcMap?
I was helping someone with some questions about classified imagery. The data was a Land cover dataset which the veteran Curtis Price had a hand in many moons ago.
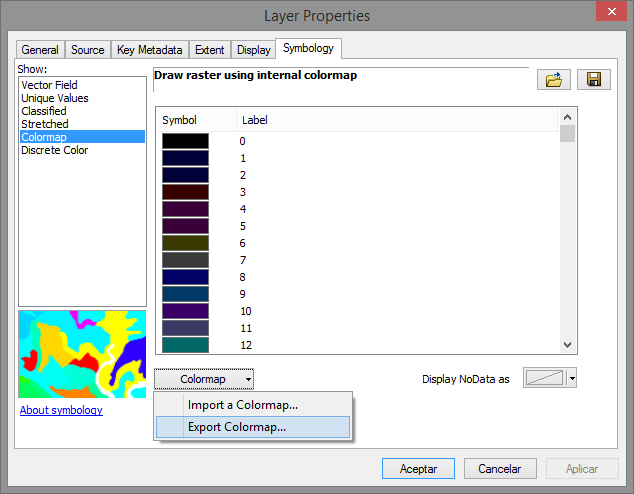
This is a classified image with a lyr file. So I exported the colour map to a clr.
the clr file looks like this (its just text so open it in any text editor):
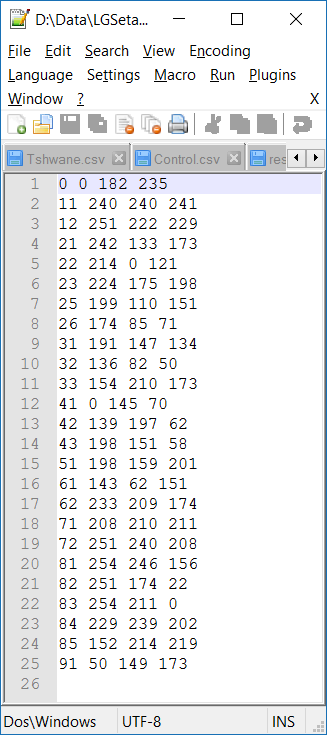
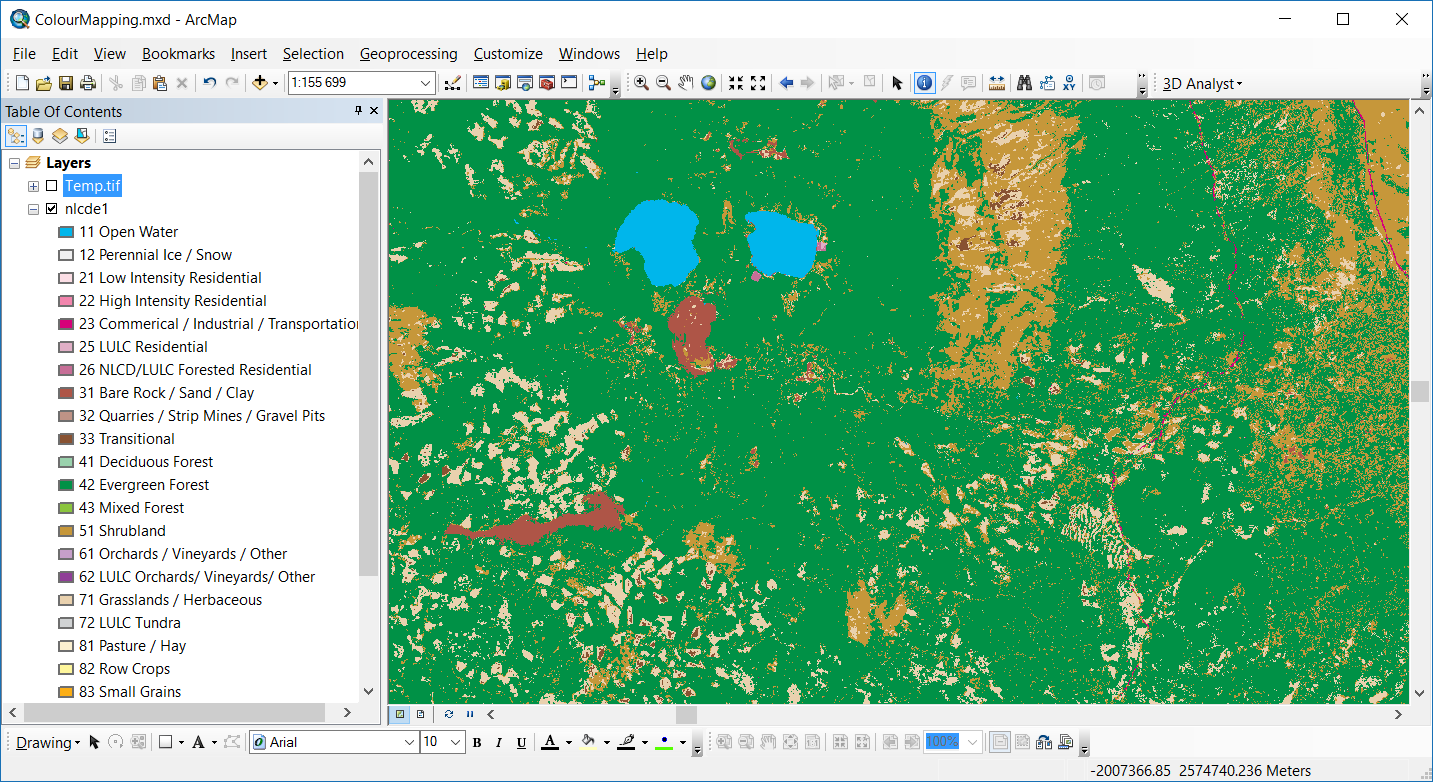
And in ArcMap the colours look like this :
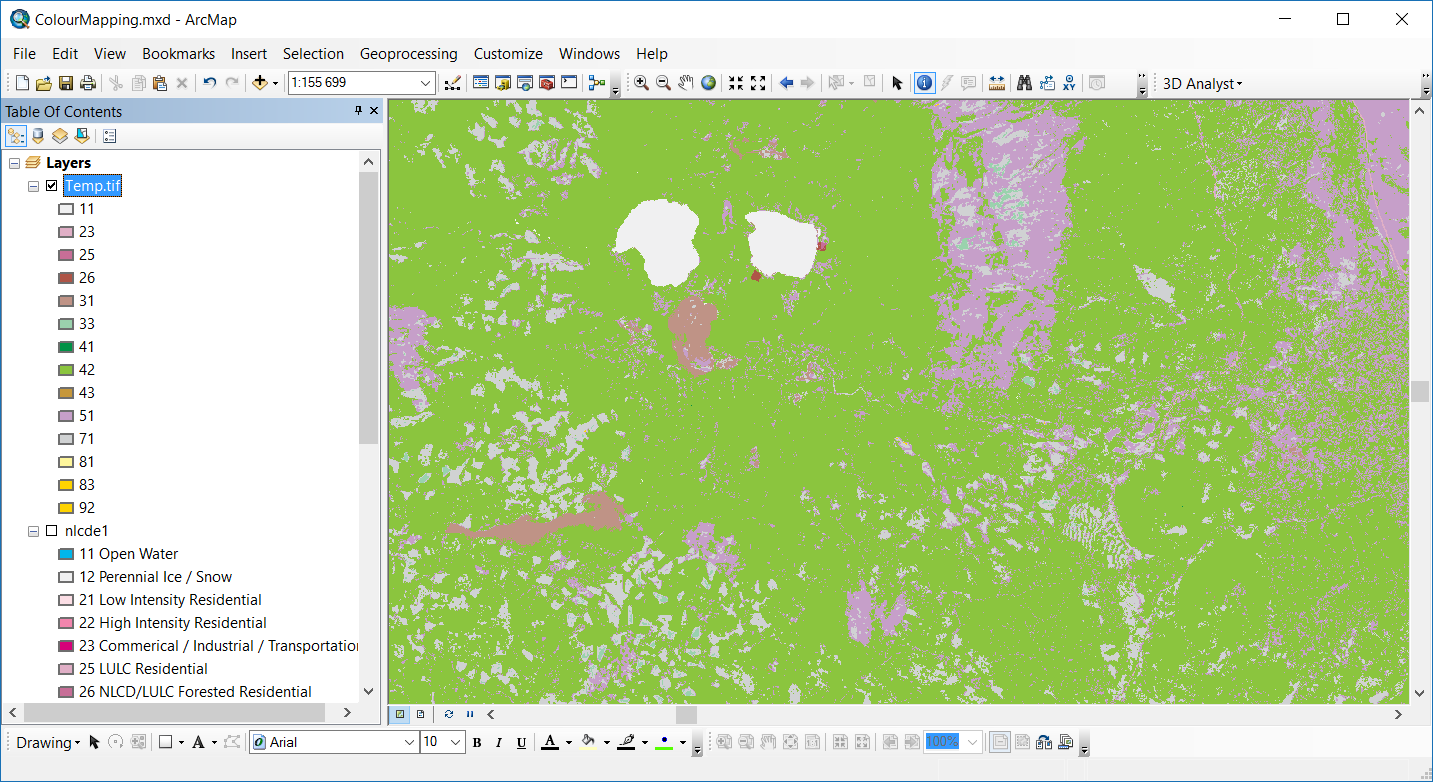
But when I clip a small portion out of this image, and re-apply the colour map I have just exported, the colours look like this :
So, what are the "r,g,b" values in that colour file.
If I use a colour picker on the web, vals 240, 240, 241 (Code 11 - Open water) is indeed a whitish shade, not blue as in the original.
- Mark as New
- Bookmark
- Subscribe
- Mute
- Subscribe to RSS Feed
- Permalink
Strange... If I load a GIF (single band) version of the screenshot with the initial color to ArcMap:
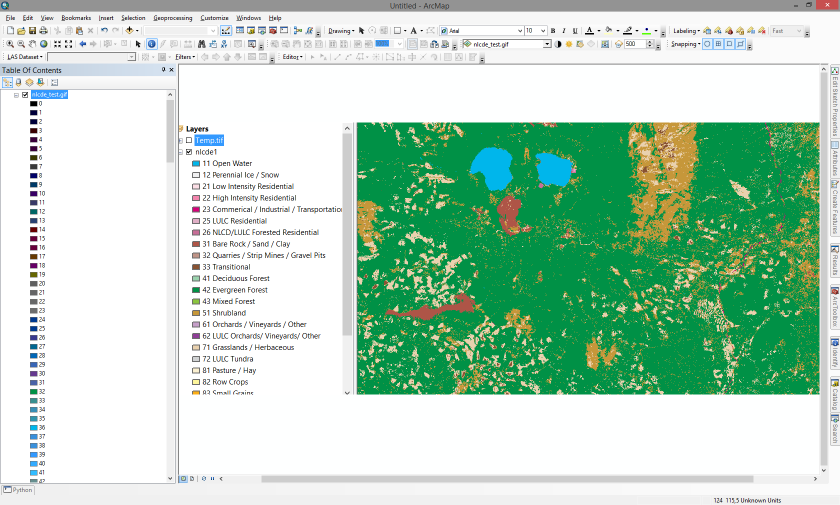
and I identify the water, it shows me value 36:

Exporting the colormap to a clr file:
and checking the RGB values for value 36:
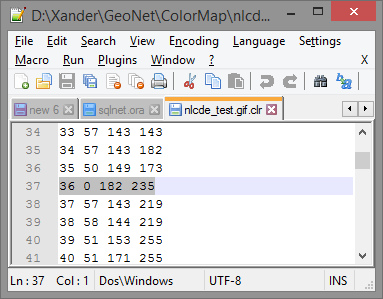
It matches exactly to the color:

- Mark as New
- Bookmark
- Subscribe
- Mute
- Subscribe to RSS Feed
- Permalink
Xander, thanks, very interesting.
I loaded the image via a lyr file which was supplied from the image (the data source just ha to be re-set).
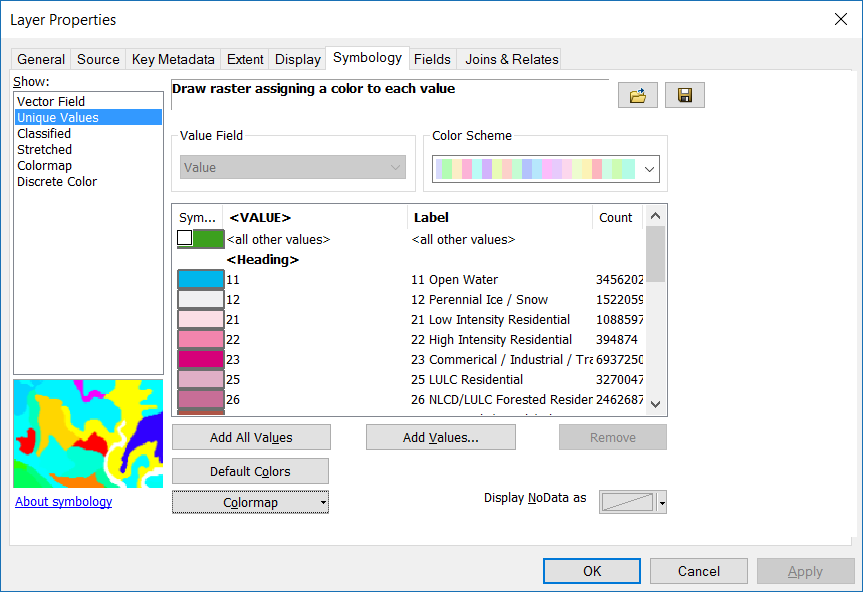
So I exported the clr from the Unique values renderer.
If I change this to the Colormap renderer, I see this whole list 0 - 255, with the actual colours, about 25 different ones, the rest are all 255, 255, 255.
I apply, of course all the labels have now been lost.
Then I export that one to clr, to get this :
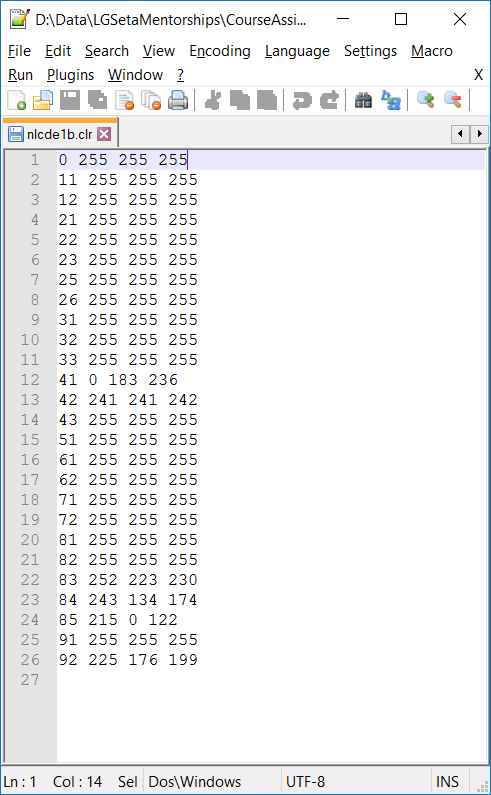
Only the first 26 (which is probably how many colours I had in the first place) are exported.
But most of these are 255, 255, 255.
What gives???
ArcMap v10.4.1 (on Win10 64bit).
- Mark as New
- Bookmark
- Subscribe
- Mute
- Subscribe to RSS Feed
- Permalink
Weird! I used ArcMap v10.4.1 too, but on Win 8.1 64 bits.
Is is possible to extract a very small part and attach it with a layerfile?
- Mark as New
- Bookmark
- Subscribe
- Mute
- Subscribe to RSS Feed
- Permalink
The RGB values in the .clr file correspond to the actual RGB values of the colors in the raster. Also my exports have the same content. No problem here. Can you attach a .lyr file of the original raster that presents the problems?
- Mark as New
- Bookmark
- Subscribe
- Mute
- Subscribe to RSS Feed
- Permalink
What may be going on here is confusing the .lyr file using the unique values renderer (which ignores the colormap, it only works with the raster values - not the rgb values) with displaying rgb values directly from the colormap.
The way to get your clipped version to look the same with the nice classified legend would be to open the layer symbology tab, choose unique values, and import the symbology from the .lyr file we published with the data, or copy the original ArcMap layer and redirect its source to the new clipped .tif file.
- Mark as New
- Bookmark
- Subscribe
- Mute
- Subscribe to RSS Feed
- Permalink
Thanks Curtis Price.
I did use this "or copy the original ArcMap layer and redirect its source to the new clipped .tif file."
Got this for the clipped bit.

At least code 11 (open water) now looks blue....
Cheers,
Neil