Select to view content in your preferred language

Use Sentinel 2 Imagery with ArcGIS

62499
29
04-27-2016 11:17 AM
ReneeBrandt
Deactivated User
11 29 62.5K

Have you been eagerly waiting to use the new Sentinel 2 imagery from the European Space Agency in ArcGIS? The wait is over! Esri has enhanced ArcGIS to simplify the use of free, global Sentinel 2 imagery. Now the full 13 band multispectral and temporal information from Sentinel 2 imagery can be quickly accessed for visualization, interpretation and analysis. Sentinel 2 imagery is of value in a range of applications including forestry, agriculture, land resource management and environmental monitoring. This is exciting news since the Sentinel 2 data compliments Landsat data accessible through ArcGIS Online.

You can now easily add Sentinel 2 scenes into ArcMap 10.4 and ArcGIS Pro 1.3 and immediately gain access to the wide range of bands combinations and indices combing the 10m, 20m and 60m spectral bands. Using a hot fix that same access can be applied in ArcMap 10.3.1. The resulting image can be viewed and analyzed using the advanced image processing and analysis tools available in ArcGIS. These include both pixel and segment based, supervised and unsupervised classifiers and can be expanded using python raster functions accessing NumPy and SciPy.

Esri has also released a workflow that enables a large collection of Sentinel 2 scenes to be quickly served as dynamic image services. These enable the full information content of Sentinel 2 to be accessible to a wide range of desktop, web and mobile applications, with all processing being applied on the fly by ArcGIS Server.

ArcGIS is ready to easily manage, analyze and disseminate the imagery and applications across institutions, organizations and new startup businesses, that are focused on land monitoring, maritime, climate and security.  

Here are the links you need!!!

Workflow to create Sentinel 2 Mosaic Dataset

Patch for ArcGIS 10.3.1

See this short video for an example of using an automated script to build and configure a mosaic dataset of your Sentinel 2 imagery.

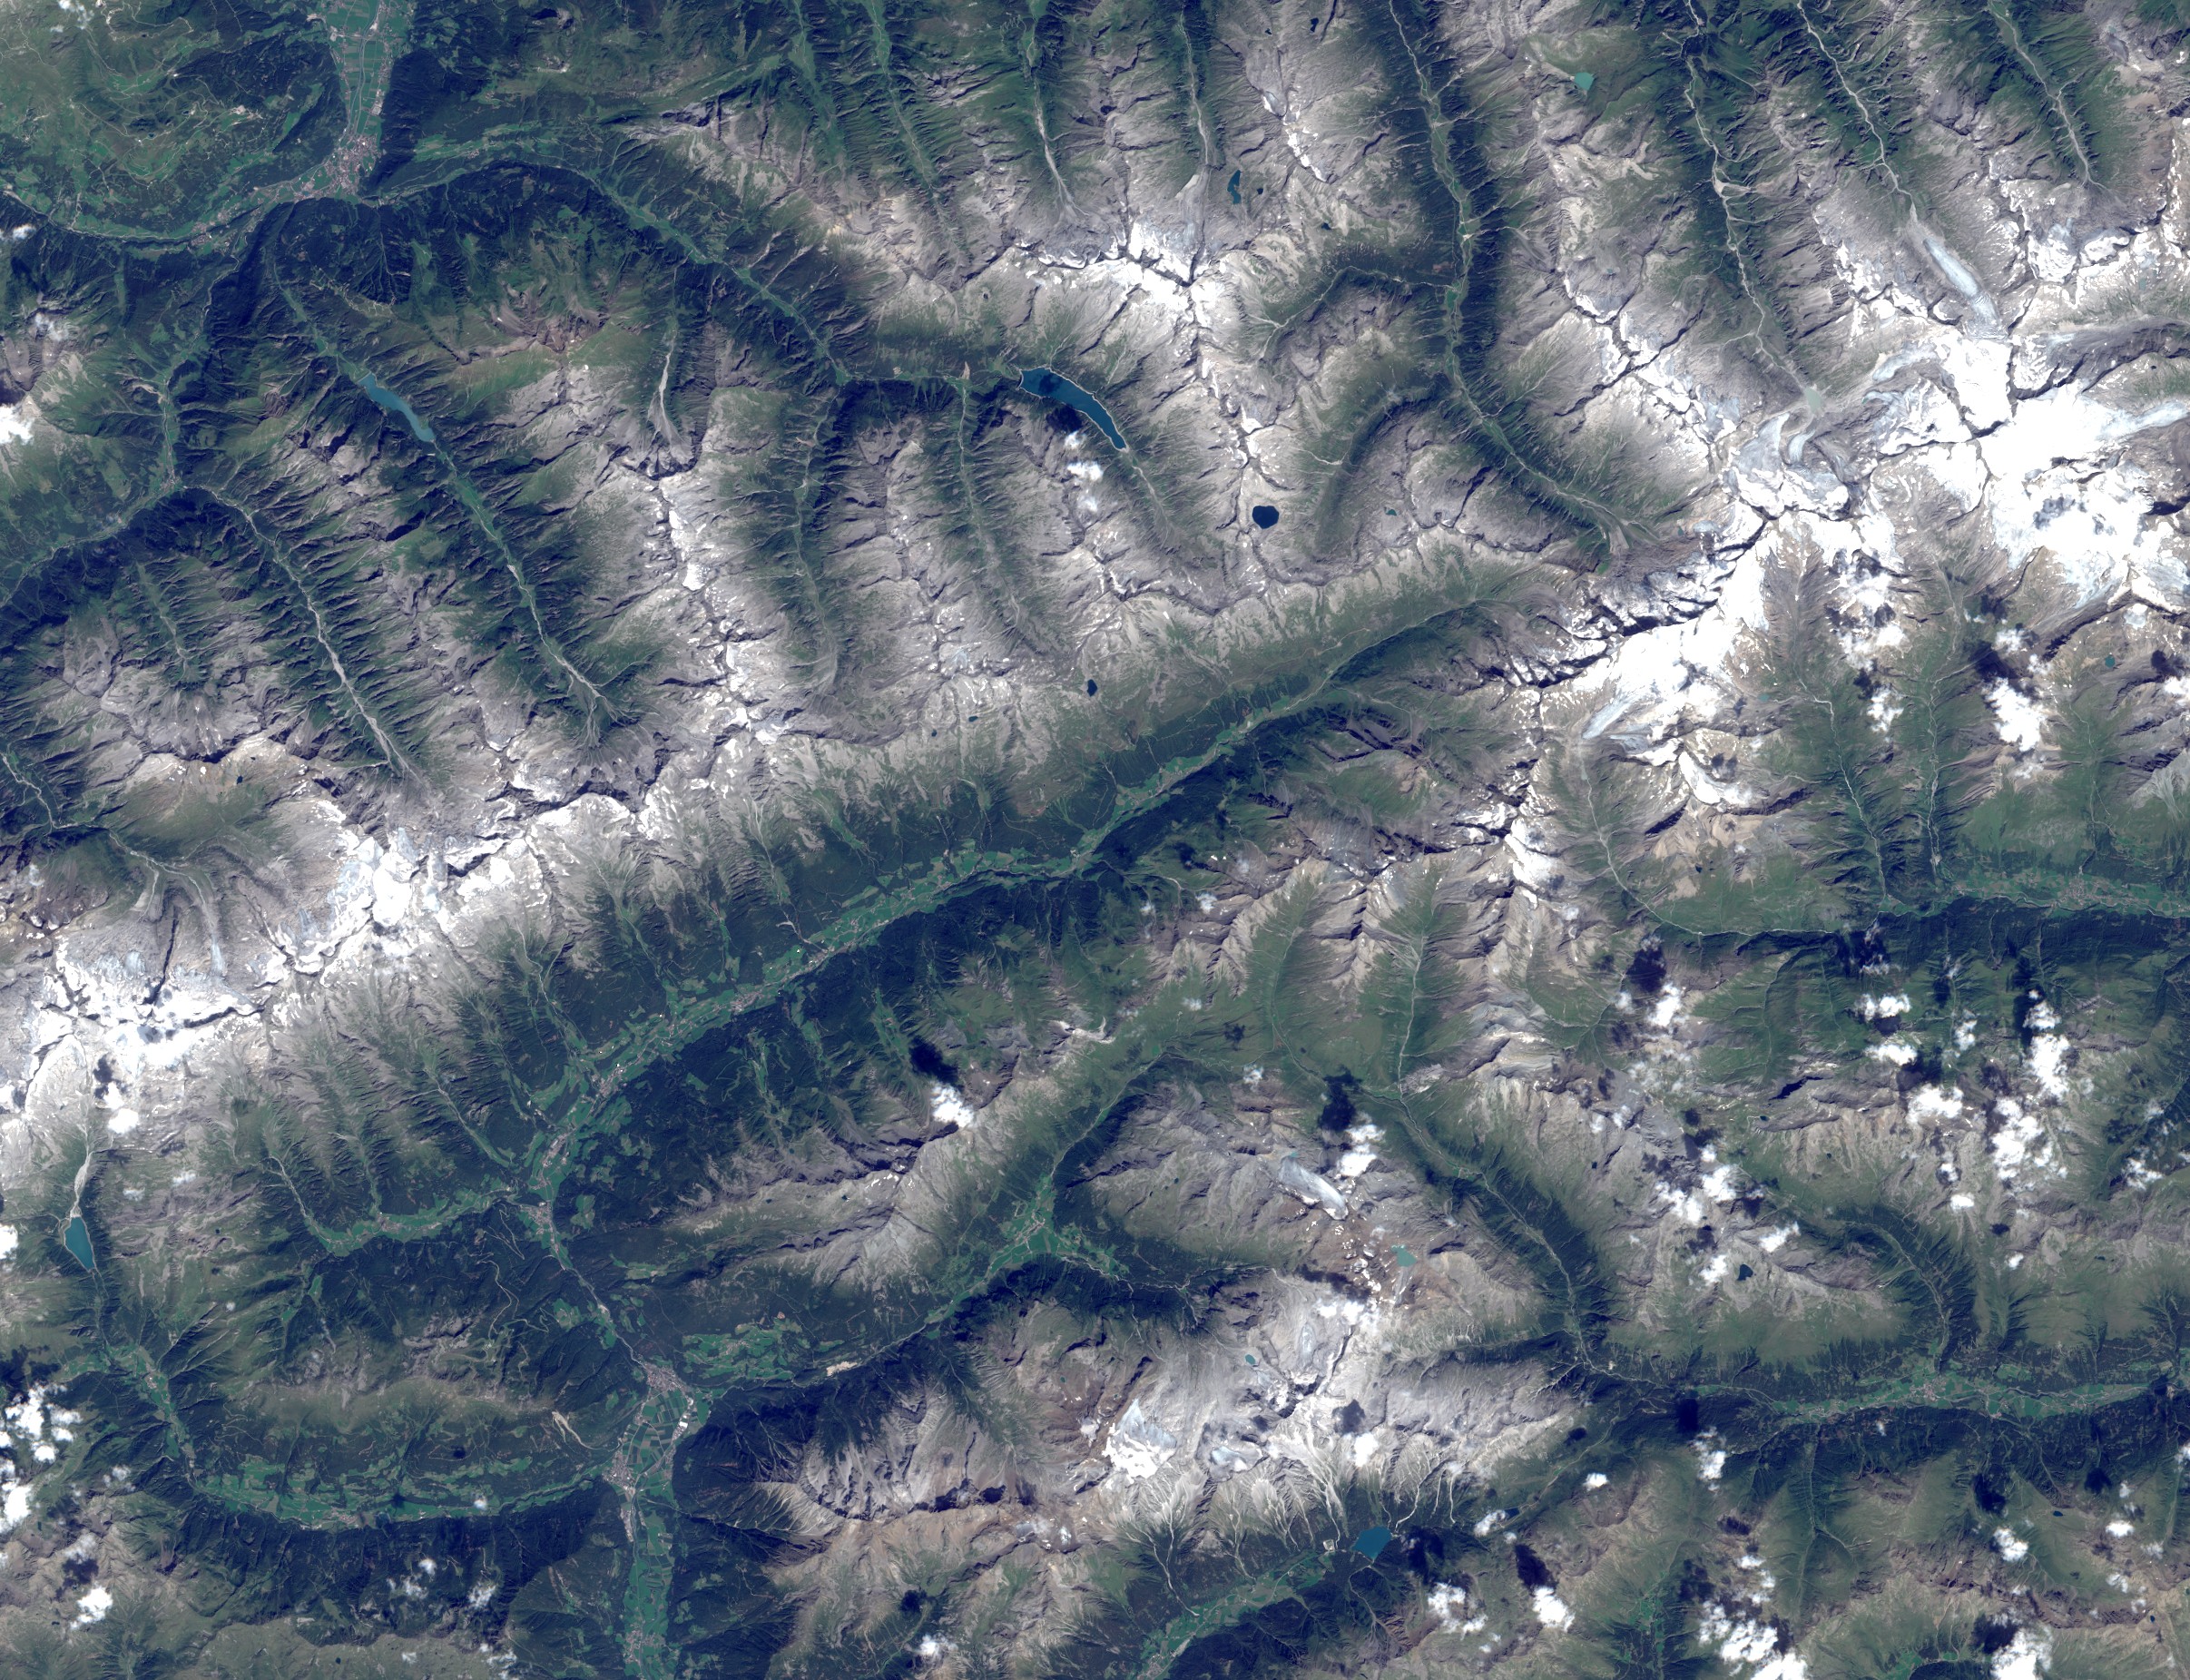
Sentinel 2 Color Infrared and Natural Color Images
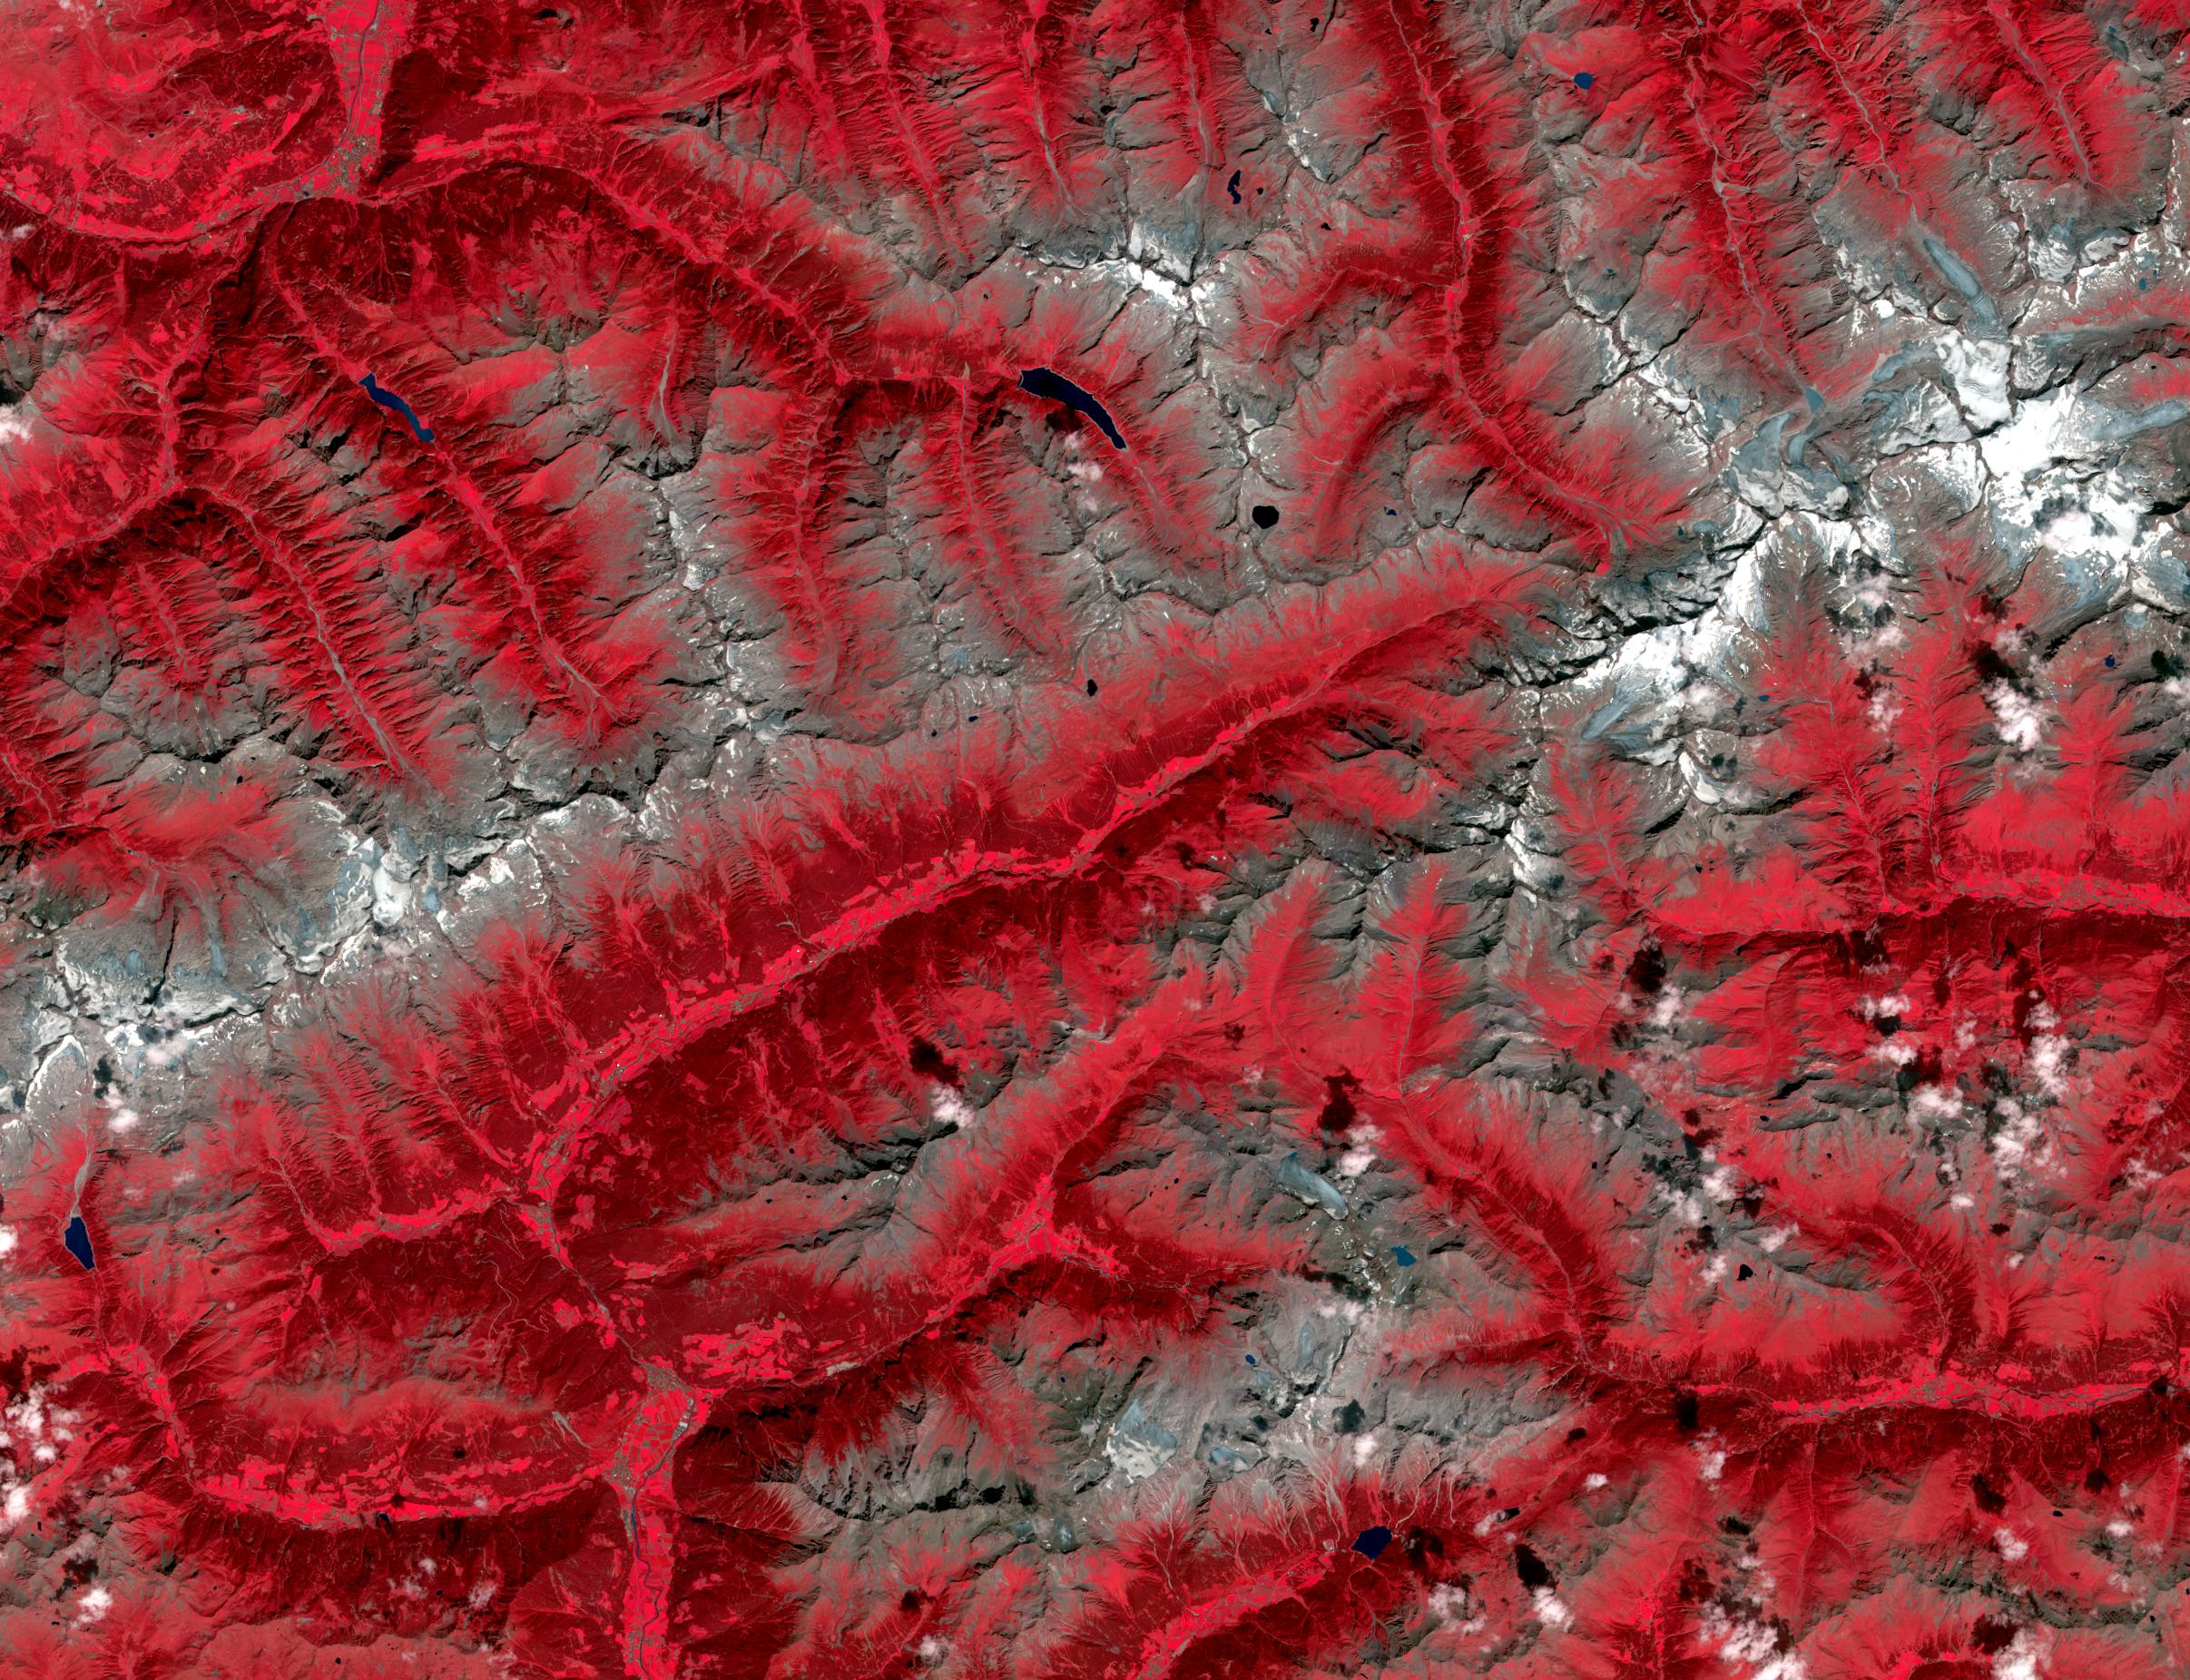
ValleAurina_SENTINEL2_CIR.jpgValleAurina_SENTINEL2_RGB.jpg

29 Comments
PanGIS
by
Frequent Contributor

This is great!

Thank you!

GregaMilcinski
Deactivated User

One option to get Sentinel-2 data in ArcGIS is to use Sentinel Hub WMS services:

http://sentinel-hub.com/apps/wms

HansDietrich
Esri Contributor

Auch im ArcGIS Blog gibt es hierzu (deutschsprachige) Informationen: Sentinel-2 Daten in ArcGIS for Desktop - ArcGIS Blog

by Anonymous User
Not applicable

Has anyone been able to visualize a Sentinel 2 Level 2A product ( atmospheric-, terrain and cirrus correction) within ArcGIS (10.4, 10.4.1) or is there no support for this product in ArcGIS?

Level 1C products (downloaded from ESA) work fine.

I create the Level 2A products with the latest Sen2Cor processor. The Sentinel Application Platform (snap) handles the Level 2A products without any problems. But in ArcGIS I get an error: "Failed to open dataset". Within Level 2A products the image data has the following folder structure (which is different from Level 1C):

BobWheeler
Frequent Contributor

Excuse my ignorance, but looking through the SciHub - there is only data for Europe and not the United States.  Is this correct?

Luke_Pinner
MVP Regular Contributor

From a quick check of the last 2 months, there's almost complete coverage of the US.

Have a look at Sentinel-2 on AWS​, in particular the Sentinel Image browser (see screenshot below).

I find it easier to download the data from the AWS public bucket, rather than from SciHub though as it's split up into 100km tiles so the download is only a few hundred MB instead of a few GB and there's no login or SciHub "maintenance" outages to deal with.  The AWS Sentinel-2 data is sourced directly from SciHub.

sentinel.png

liteng
by
Emerging Contributor

hi, Brandt. i encountered an error when using this script as tools in  arcgis10.3, and ask a question here. looking forward to your attentions, really thanks.

MervynLotter
Frequent Contributor

To run this script you will need ArcMap 10.3.1 (with this

http://support.esri.com/en/downloads/patches-servicepacks/view/productid/66/metaid/2284)

or 10.4 or Pro 1.2.

KoryKramer
Esri Community Moderator

Note that there is a known file system limitation wherein if the full path and filename exceeds 256 characters, the Sentinel 2 data will not display in ArcMap.  If the unpacked Sentinel 2 folder is located in a directory structure where the path is longer than 256 characters, you will not see the Multispectral component layers underneath the raster product when viewing the file structure in the Catalog window or ArcCatalog.  Further, dragging the product into the Data View will not display anything.

Shorten the file path so that it is less than 256 characters and the Sentinel 2 data should work as expected.

CodyBenkelman
Esri Regular Contributor

Kory raises a good point - the path names are inherently long, and if over 255 characters it causes problems.  In our workflow download (referenced at top Workflow to create Sentinel 2 Mosaic Datase) includes a python script to shorten path names to address this problem.

Jobde_Vries
Deactivated User

Can somebody share some more information about reducing the length of the path files? 

I've downloaded sentinel 2A images in zip files, even when I try to unzip them I get the error long path in windows10. I've downloaded the python script, provided by esri. But when I run this python script in pythonwin2.7 I can't get it to work. The instructions in the script are rather minimal: 
"Change parent_folder_path to the input folder to be renamed"

Do I need to include the paths of the zipfiles in the script or do I need to run the script with an input argument containing the path location? And what folder do I need to select as pathname in order to shorten the names, allowing me to unzip the files and open them in ArcGIS 10.3.1?

Thanks in advance! 

MervynLotter
Frequent Contributor

Hi Job

I am not behind my computer now but can confirm that you need to unzip the

downloaded sentinel 2 file, then only rename the file with the .safe

extension (if memory serves me well, perhaps it was. saf) ). Just shorten

it and then point the script to this file.

Once shortening file name, script works really well.

CodyBenkelman
Esri Regular Contributor

Job

My apologies if the user doc for that renaming script were not clear.  Did you run it and not succeed?  


Wait, I see that the string you copied above ("Change parent_folder_path to the input folder to be renamed") comes directly from the script; did you see the user doc in the download?  Text is copied below

Cody B.

If path renaming is required, users can run the script ‘RenameSentinel2Data.py’ (found in the Scripts folder) and pass in the name of the folder containing the GRANULE subfolder, e.g.:

> python.exe RenameSentinel2Data.py d:\XXX_Long_Path_XXX\S2A_OPER_PRD_MSIL1C_PDMC_20150818T101216_R065_V20150806T102902_20150806T102902.SAFE

If the user has multiple satellite scenes, the script ‘RenameSentinel2Data.py’ can take the root folder as input and will rename all subfolders named S2A*NAME.SAFE, e.g.:

> python.exe RenameSentinel2Data.py d:\XXX_Long_Path_XXX

Jobde_Vries
Deactivated User

Thank you for clarifying! I ended up using unzip software and then running the Sentinel2 tool, loved how smoothly it works, thank you! It was not necessary to shorten the names, although it is very convenient if you are handling multiple images. 

One more question related to the sentinel2.pyt software. I a very nice ( !) mosaic file out of roughly 10 sentinel images, i'm just wondering if I can access for example band 8a and 12 to do some index calculations (similar to NDVI) with for example raster calculator. It would be very convenient if I could just do the index calculation once, rather than importing the 10 relevant images (x2 bands) and do the index calculation for every separate image (and then for multiple time steps). 
When I import the multispectral orthomosaic it will not allow me to access the individual bands in the image, it only recognizes band 1,2 and 3. 

Thanks already for the help, really appreciate it!

AlinPlesoianu
Deactivated User

ESA recently changed the product definition for Sentinel-2 data.The images now a in a single tile, opposed to multiple tiles as before, so many of the ArcGIS tools need to be upgraded as well.

I tested the ArcGIS tool with the sample Sentinel-2 image (link: https://scihub.copernicus.eu/news/News00106 ), and I can no longer insert the Sentinel-2 image into the  mosaic dataset.

On a side note, when I create a Sentinel-2 Mosaic Dataset with the tool, for an old format image, the 10m resolution MD does not have the Band  8 (IR) of the image, only the Bands 2, 3 and 4. The band 8 is also a 10 m image.

CodyBenkelman
Esri Regular Contributor

Job

You should use a Mosaic Dataset to access and process multiple images - see What is a mosaic dataset?—Help | ArcGIS for Desktop    The Mosaic Dataset creates a VIRTUAL mosaic on-the-fly from many images, and allows you to do exactly what you're asking - apply band arithmetic to all images as if a mosaic, but the mosaic is dynamic (e.g. if you have an image w/ clouds in foreground, you can bring a background image to the foreground using the Mosaic Method).


also note the Image Analysis Window allows you to run NDVI but specify any bands, so if you need that exact math, just use NDVI.

You should not need to copy pixels and output new rasters, just do everything on-the-fly in the Mosaic Dataset, then if you really need an output image you can use Export to save to disk.

Cody B.

CodyBenkelman
Esri Regular Contributor

Alin

I am not familiar with the new format, but I have verified that our Dev team is, and we're working to determine any changes that may be required.

As for the 10m mosaic only showing Bands 2, 3 and 4, are you using ArcMap at 10.4?  This is a limitation in the user interface for band selection after a Raster Function has been applied.  Band 8 is there, but you can't access it by changing bands in the table of contents (TOC).  Right click on the Image layer in the MD, select Properties then the Processing Templates tab, and choose Color Infrared or NONE.

If you choose Color IR, you'll get bands 8 4 3.    If you choose None, then all bands should appear in the TOC and you can select any of the 10m bands.  

If you want a Mosaic Dataset that references all 13 bands, run the "Multispectral" option in the tool

I  will try to clarify the documentation regarding how to access the different bands via the Table of Contents.

Thanks
Cody B.

AlinPlesoianu
Deactivated User

Hi Cody!

Thanks for the reply. You cleared my misunderstandings of the Sentinel-2 MD toolbox. I hope the team will finish the update as soon as possible.

Do you know of any problems regarding the  calculation of statistics for the resulting mosaic dataset? When I try to calculate the statistics, they do not get created, even if the tool runs without problems.

Thanks a lot!

Alin

CodyBenkelman
Esri Regular Contributor

Alin

I'm not aware of problems with calculating statistics - I just tried on a Mosaic Dataset with one Sentinel-2 scene, and skip factors of 3 x 3, and it took approximately 3 1/2 minutes, but the stats were successfully calculated & stored.

Note that calculation of statistics is a longstanding issue because it can take so much time, and in some cases (e.g. elevation data), the results aren't terribly meaningful (such as "does anyone care what the mean elevation is for Spain?").  For viewing, I typically use dynamic range adjustment (DRA) stretch applied to only the area being displayed, and when I need statistics for large datasets to enable other functionality, I will often simply SET nominal statistics, knowing they are not precise, but that is often acceptable.  You can set stats in just a few seconds using the set raster properties (data management) GP tool.


Cody B

AlinPlesoianu
Deactivated User

Thanks again.


Do you use the Dynamic Range Adjustment stretch as a raster function, or is there an option in the Mosaic Dataset's settings?


Alin

CodyBenkelman
Esri Regular Contributor

Alin

I was referring to activating DRA on a layer when displaying an image or Mosaic Dataset in the map.  You can do this in ArcMap from Image Properties/Symbology/Stretch in the table of contents, or call up the Image Analysis Window, select the layer, and turn on the DRA checkbox.  If using Pro, these appear in the Raster / Appearance tab.

As described, this would apply only after loading an image into the map (or you can save an MXD (ArcMap) or APRX (Pro) project and these settings would be retained when you reload the project).

But if you want a Mosaic Dataset (or image service based on the MD) to always display using DRA, yes, you can apply this as a Function.  Use the Stretch function, and in the properties, select the DRA checkbox - but note you also have to set a stretch type other than "none".  (It's a bit confusing because in the desktop map, if you click "DRA" it is applied immediately.  In the function, if you click "DRA" but leave Type to None, then no stretch is applied, so you need both settings)

AlinPlesoianu
Deactivated User

Thank you very much Cody. I will use the DRA stretch option as a raster function to automate my work.

Regards,

Alin

Edward_FabianCetina
Esri Contributor

Hello everyone, I'm having an issue trying to read the metadata file of sentinel in ArcGIS (MTD file with .xml extension). I try to add the metadata file in ArcMap 10.4.1 or ArcGIS Pro 1.3 and appears this error: "Invalid raster dataset. Failed to create raster layer". "Could not add the specified data object to the map"."Could not open source as a raster dataset".

I check all the files from the image and there are ok. I try with other sentinel images and have the same problem. Do you know if i need to install additional resources or i'm forgetting something? 

P.D: The customer that show me this issue told me that they can read the files in QGIS.

Regards,

Fabian

CodyBenkelman
Esri Regular Contributor

Fabian

what is the date of your Sentinel image?  ESA changed the format (see this press release https://scihub.copernicus.eu/news/News00102 ), and satelite scenes written in the new format are not fully supported by ArcGIS, although you can still read and process the imagery.  I am guessing you have a new format scene.

Several points follow:

  • I have not yet been able to verify the exact date of the format change; the press release says 27 September 2016, but I have seen other posts mentioning later dates.  If anyone on GeoNet can confirm specifics, please add a reply.
  • My comment about "fully supported" refers to the Raster Product (drag & drop the XML file into ArcMap) or ingesting into a Mosaic Dataset using the Sentinel 2 raster type.  This support provides full metadata access and views each scene as a proper multispectral image.  Satellite scenes in the original format are supported in ArcGIS 10.4, 10.4.1 and 10.5.
  • The change to the new format came at a point within our software development cycle that prevented a modification from being implemented in our most recent version (10.5).  Scenes in the newer format can be accessed in ArcMap if you go to the xxx\granule\scene_name\img_data folder and access individual spectra bands as separate JP2 files
  • You may see references to an automated processing script at http://www.arcgis.com/home/item.html?id=e6e1f20cb0374d28a6eed24f5c2ff51b which was built to use the Sentinel 2 Raster Type.  As a result, this script will work with the older format, but not the newer file format.
  • Development is underway for support of the new format, but we don't have an availability date at this time.
    • My ORIGINAL REPLY was 13 Jan 2017; UPDATE 17 Feb 2017:  support for the metadata format after the change in Sept. 2016 will be included in ArcGIS 10.5.1.  Until then, you can access individual bands as JP2 files (see 2 paragraphs back)

Cody B.

SebastienCharlier1
Deactivated User

I'm working too with L2A and L1C and both fail on charging. L2A fail because the metadata are formated in a different way they don't use the same argument and L1C from ESA when you take a granule avec a also changed the way to give information about where the image is stored. So we have 2 option, correct the metadata manual or wait ESRI give us a robust charging prosses.

SebastienCharlier1
Deactivated User

I have a question that can solve a lot of trouble, why not change or add a new command in ArcGIS to add raster in mosaic where you can manual set the band as parameter? Like that we could build toolbox and improve custom mosaic with an easy way. That could be really useful for all who are in institution where ArcGIS version isn't correctly deployed (we still in 10.3.1 for my institution...) 
That could be really nice and avoid for some us to look at other product just because we can't do the job in ArcGIS in less than 10 minutes as it's when you get have the tool.

I can understand that ESRI like to get hand on most of the code but I think this improvement can be interesting for all member of the community and help to provide support for a lot of product like Sentinel L2A L2B or L3A product.  

ChristophGoßen
New Member

Level-2A products are not yet supported in terms of a built-in raster product (as of ArcGIS 10.5.1, ArcGIS Pro 2.0).

Regarding visualization, maybe you find some prepared symbology sufficient, like that provided by the ArcGIS-Sentinel2-Download-Tools. The Download tool displays a L2A product by a Group Layer, composed of confidence images for cloud (CLD) and snow/ice (SNW), a natural color composite (TCI), and a scene classification image (SCL), along with appropriate symbology:

SCL of the upper product on the left, CLD+SNW+TCI of the lower product on the right.

You don't need to download a respective L2A product once again just to get it symbolized like shown in the screenshot above – if a specific L2A product already exists on your local disk, the Download tool skips the respective download action, but finally displays the product along with aforesaid symbology. The steps to take are as follows:

  1. Let the Search tool find the products that already exist on your local disk.
  2. In the attribute table of the search results, set the Marked attribute for products you want to get symbolized.
  3. Execute the Download tool (in this scenario, it merely applies the symbology to the processed products, i.e. skips the respective download action for any product that already exists locally).

UPDATE (2018-06-24): The L2A group layer is now enriched by various optional water indices (NDWI*, MNDWI*, WRI*, MBWI, WI2015*, AWEInsh*, AWEIsh*, etc.), along with optional supplementary functionality (i.e. additional binary mask layers derived from the respective cloud or snow/ice image, as well as cloud or snow/ice filtering for filterable* indices):

Various water indices (based on L2A band images).

The screenshot illustrates the Rhine flood of January 2018 nearby the city of Rees (Germany), where the water bodies of the pre-flood situation (T31UGT_20171119T104331) are displayed in yellow, whereas the water bodies of the flood situation (T31UGT_20180108T104421) are displayed in pink.

The index calculations are performed on the fly by means of ArcGIS' raster functions. The respective function chain declaration is script-generated, e.g. the script line for generating a MNDWI index layer reads (with applied threshold value of 0.05):
index(BandArithmetic(CompositeBand("F32", B["03"], Resample(B["11"])), "(b1-b2)/(b1+b2) -5/100"))

This allows for individual modifications, for example to adjust the default threshold value, to extensively modify a formula's arithmetic expression, to rearrange the function chain, or to quickly implement your very own index.

AsmaNKHILI
Occasional Contributor

Hello, i want to know if i can use Sentinel 2 imagery collection with the new Ortho-Mapping Workspace in ArcGIS Pro 2.0.1. i tried to use but in vain...No imgery collection where uploaded, i tried to use also the tool that you mentionned on your post but it doesn't work. 

Exécution du script Sentinel2...
Traceback (most recent call last):
File "<string>", line 221, in execute
ImportError: No module named 'MDCS'
Échec de l’exécution de (Sentinel2).

WillAnderson
Occasional Contributor

Has anyone ever been able to access the most recent (within last 2 days of acquisition) imagery in either Sentinel-2 Views or Sentinel-2 Level-2A imagery services from Esri? I haven't, even with filters/def queries removed and when I can access yesterday's imagery for given tile/area in other services (Sinergise EO Browser, Copernicus SciHub) that apparently consume the same AWS-hosted data as Esri is using for these services. As it is now, have to download tiles for anything less than 3-4 days old rather than being able to leverage the Esri services. Anyone?