- Home
- :
- All Communities
- :
- Industries
- :
- Education
- :
- Higher Education
- :
- Higher Education Questions
- :
- Polyline to Raster - any way to set value preferen...
- Subscribe to RSS Feed
- Mark Topic as New
- Mark Topic as Read
- Float this Topic for Current User
- Bookmark
- Subscribe
- Mute
- Printer Friendly Page
Polyline to Raster - any way to set value preference
- Mark as New
- Bookmark
- Subscribe
- Mute
- Subscribe to RSS Feed
- Permalink
Hi, I have a road feature class. I want to change the vector lines to raster values. Is there any easy way to specify cell value by preference at junctions?. For example, Road type A with Road B at a T junction. Some times it chooses to make the cell Road Value A some time Road Value B. Two junctions below. Western junction takes value of Brown. The Eastern junction takes value of Green. For my use I want the cell to always take A value at junctions of A/B .

I am using Arcmap 10.6.1. Raster cell size is 1m.
Solved! Go to Solution.
Accepted Solutions
- Mark as New
- Bookmark
- Subscribe
- Mute
- Subscribe to RSS Feed
- Permalink
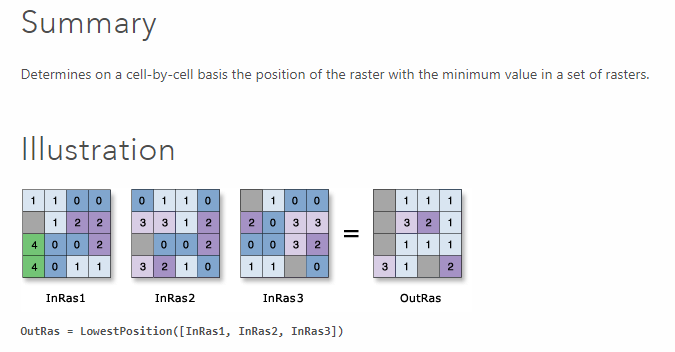
The output is the position of the raster with the lowest number for that cell. Ie. Its saying raster 3 has the lowest, faster 2 has the lowest etc. On a cell by cell basis. Dependent on the order you add them to the tool.
- Mark as New
- Bookmark
- Subscribe
- Mute
- Subscribe to RSS Feed
- Permalink
Create a taster for A and a taster for B.
Ensure the same cell size and snap raster are specified in the environments.
Turn NoData values to 0 in both tasters (reclassify). Add together both rasters in raster calculator.
Reclassify the output raster values. E.g. if A =1, B = 2 there will be a raster cell with a value of 3 at the junction. Turn this value back to 1.
- Mark as New
- Bookmark
- Subscribe
- Mute
- Subscribe to RSS Feed
- Permalink
Looking at this as an option but it does become complicated with more layers. Also looking at varying the cell size and the Lowest Position tool.
Thanks,
Jeff
- Mark as New
- Bookmark
- Subscribe
- Mute
- Subscribe to RSS Feed
- Permalink
In your example, a majority filter with FOUR for number of neighbors should work in most situations
- Mark as New
- Bookmark
- Subscribe
- Mute
- Subscribe to RSS Feed
- Permalink
Thanks Dan, having a look at the majority filter. Just as an aside as you seem deeply knowledgeable. Can you explain the Lowest Position example from ESRI help? I thought I understand the text but the graphical example does not make sense to me. The text indicates it used the lowest value of the rasters but the example does not. Also are they treating 0 as a value as it does not seem to carry though to the outras. For example if in lower left corner, the three input values are 4,3,1 surely the outras cell value for that location should be 1 not 3. Similarly in second row, third cell the outras is 2 but the three inras values are 2,1,3. Is this an ESRI help error or do I just not understand what the tool should be doing. Thanks again for your continued help!!!
- Mark as New
- Bookmark
- Subscribe
- Mute
- Subscribe to RSS Feed
- Permalink
The output is the position of the raster with the lowest number for that cell. Ie. Its saying raster 3 has the lowest, faster 2 has the lowest etc. On a cell by cell basis. Dependent on the order you add them to the tool.
- Mark as New
- Bookmark
- Subscribe
- Mute
- Subscribe to RSS Feed
- Permalink
Jeff,
LowestPosition is to enable on to examine data which may have a sequential nature. For instance, data collected over time. The example that is used represents 3 separate rasters collected at different times for some attribute. If you are interested in "when" something happened you would use
Lowest Position—Help | Documentation
Highest Position—Help | Documentation
or even
Popularity—Help | Documentation
For these tools, it is less about the value in the raster but the sequential nature of the data.
The topic in the "concepts" section has further explanations which may make it clearer (or murkier  )
)
Finding the position from an input list meeting a specified criterion—Help | Documentation
- Mark as New
- Bookmark
- Subscribe
- Mute
- Subscribe to RSS Feed
- Permalink
Thanks, I was thinking cell value not raster layer.
My shotgun approach to exploring ESRI tools has lead me to a solution to my problem. I export each Vector by classification [five classes for my data], rasterise each independently and add them together using Cell Statistics with MIN overlay statistics and I get what I need. The lowest value at each junction being selected. Again thanks to everyone for helpful suggestions.
Cheers
Jeff