- Home
- :
- All Communities
- :
- User Groups
- :
- GIS for Geology
- :
- Questions
- :
- geological cross section
- Subscribe to RSS Feed
- Mark Topic as New
- Mark Topic as Read
- Float this Topic for Current User
- Bookmark
- Subscribe
- Mute
- Printer Friendly Page
- Mark as New
- Bookmark
- Subscribe
- Mute
- Subscribe to RSS Feed
- Permalink
HI everybody,
I have a soil classification (raster ans shapefile), and topographic cross section made from a DEM.
I would like to ''colorize'' the cross section depending on the classification. to summarize I want to visualize on the cross section the soil occupation.
is it possible ?
Many thanks
Maxime G.
Solved! Go to Solution.
Accepted Solutions
- Mark as New
- Bookmark
- Subscribe
- Mute
- Subscribe to RSS Feed
- Permalink
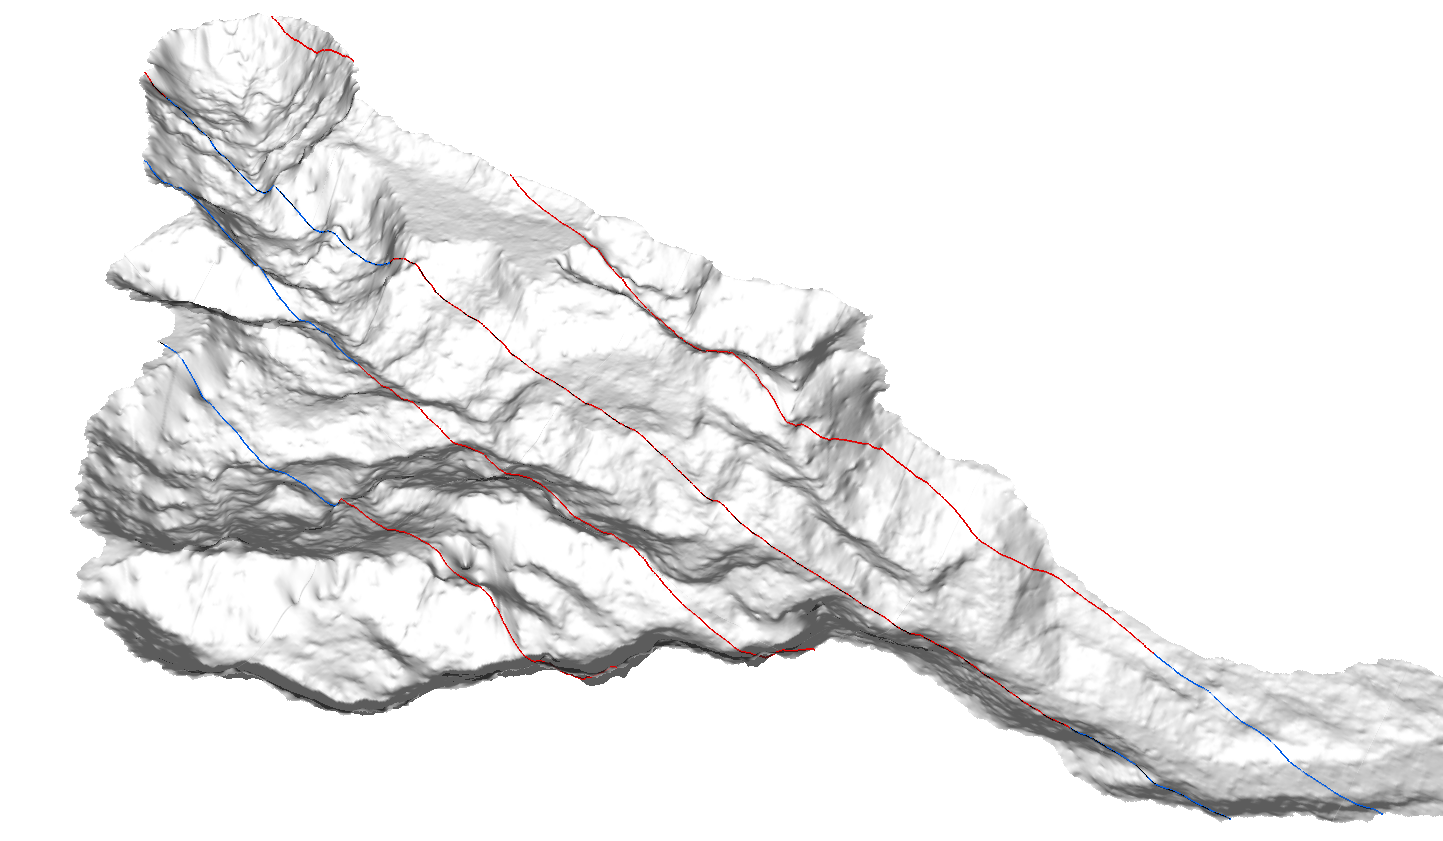
mhmhmp., this could be viewed through arcscene..
- Mark as New
- Bookmark
- Subscribe
- Mute
- Subscribe to RSS Feed
- Permalink
If you can create polygons from the cross-section then that would be easy. If your cross-section consists or raster or vector lines, then they would have to be closed to form either polygons or raster zones.
A picture of what you have would help
check the code sharing site eg. http://www.arcgis.com/home/item.html?id=e86077dc453e4152a14c2e861de7fc01
- Mark as New
- Bookmark
- Subscribe
- Mute
- Subscribe to RSS Feed
- Permalink
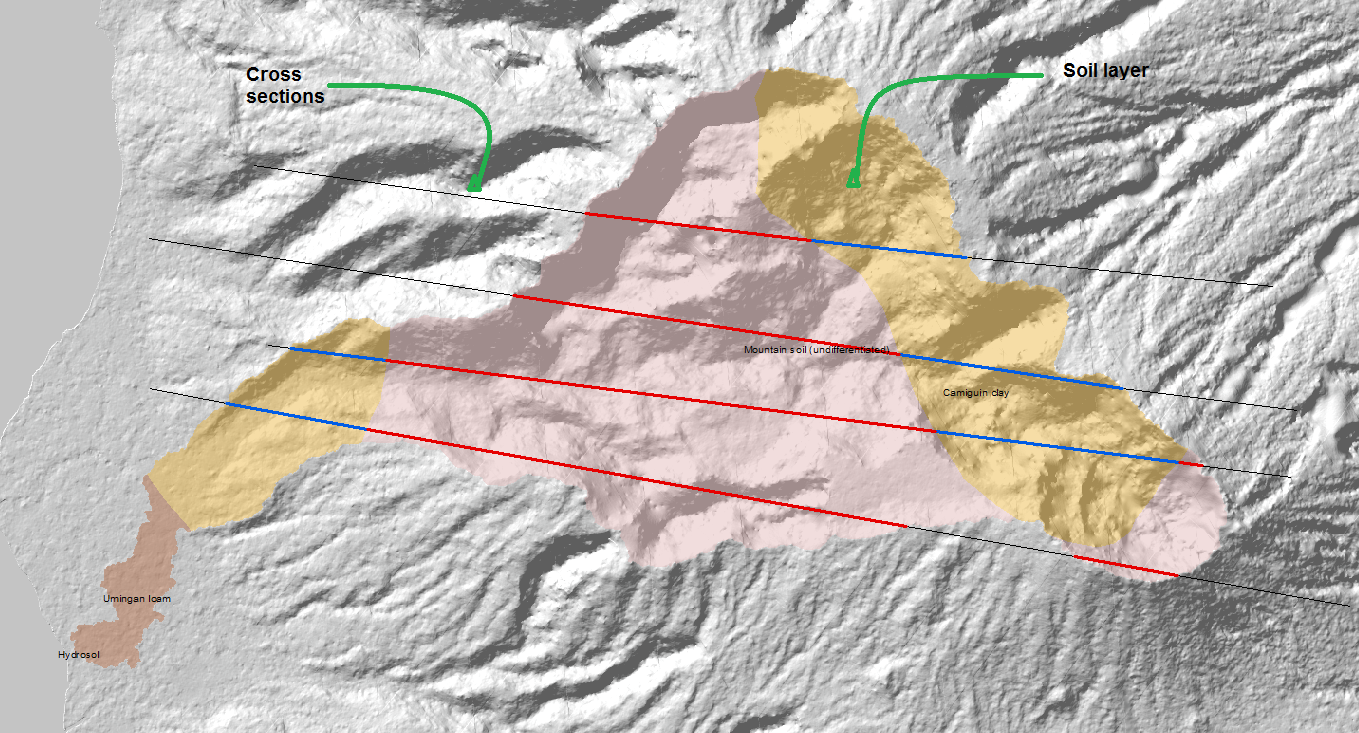
I have :
- a DEM
- Polygones files, with a field depending of the soil occupation on the attibute table
- A polyline where I want to have my cross section
- then, with the 3D analyst toolbar I've mad the cross section according to the elevation of the DEM
- Mark as New
- Bookmark
- Subscribe
- Mute
- Subscribe to RSS Feed
- Permalink
well you can't make that profile into a colorized depth plot... look at the tool that does cross-sections or examine the options on the code sharing site
- Mark as New
- Bookmark
- Subscribe
- Mute
- Subscribe to RSS Feed
- Permalink
Thank you for your help,
I will check then come back to update this post
- Mark as New
- Bookmark
- Subscribe
- Mute
- Subscribe to RSS Feed
- Permalink

It is possible when doing clip using vector layers...
- Mark as New
- Bookmark
- Subscribe
- Mute
- Subscribe to RSS Feed
- Permalink
This is top view but is it possible to see as a topographic cross section ?
- Mark as New
- Bookmark
- Subscribe
- Mute
- Subscribe to RSS Feed
- Permalink
mhmhmp., this could be viewed through arcscene..