Turn on suggestions
Auto-suggest helps you quickly narrow down your search results by suggesting possible matches as you type.
Cancel
- Home
- :
- All Communities
- :
- Products
- :
- Geoprocessing
- :
- Geoprocessing Questions
- :
- Field Calculation Between Two Feature Classes
Options
- Subscribe to RSS Feed
- Mark Topic as New
- Mark Topic as Read
- Float this Topic for Current User
- Bookmark
- Subscribe
- Mute
- Printer Friendly Page
Field Calculation Between Two Feature Classes
Subscribe
10-02-2013
01:03 AM
- Mark as New
- Bookmark
- Subscribe
- Mute
- Subscribe to RSS Feed
- Permalink
Hi,
I have a feature class containing two summed values (two attributes). I need to find out if one is less than or more than 20% of the other.
Is it possible to field calculate this in the same feature class? I have tried to export to two separate feature classes but cannot see a tool to call different fields from different feature classes in the same calculation.
Thanks in advance,
Mark
Solved! Go to Solution.
15 Replies
10-07-2013
05:13 AM
- Mark as New
- Bookmark
- Subscribe
- Mute
- Subscribe to RSS Feed
- Permalink
Hi,
Thank you all for your detailed responses. Unfortunately the Pivot Table tool is only available in with an ArcInfo or advanced license as its now called and I only have ArcEditor. Very frustrating!
Here is some more information on my problem or end goal.
I have a line feature class in a file geodatabase which has two relevant fields, [Use_Class] and [Shape_Length]. There are various different types of Use classes. The use classes relate to commercial buildings and what they are being used for - their use class.
In particular there is a use class called A1. It is this A1 use class that I need to compare all other use classes to; all other use classes must not exceed 20% of the total length of A1 use class.
The user selects (parameter input) the various lines be they A1, B1, C1 D1, etc and the script dissolves based on the use class value giving the summed result or total length by use class.
Now what I want to do is select all use classes not equal to A1 and sum those values. Once summed I wish to check that that summed value is not greater than 20% of the summed A1 value. I am having difficulty doing this as the data to query is in the same field.
Hope all that makes sense.
Mark
10-07-2013
05:33 AM
- Mark as New
- Bookmark
- Subscribe
- Mute
- Subscribe to RSS Feed
- Permalink
Actually, by the sound of your problem, it doesn't seem that difficult...let's cover the math 1st, if this is correct:
Say you have 2 numeric values, represented by A and B, with A being the smaller of the two. A divided by B should give you basically a proportion or percentage (if you multiply by 100) of what A is relative to B. Then all you'd really need to do to identify records less than a 'threshold' value (which you said is 20%) is simply to select what result is either under (< 20%) or over (> 20%). ...from there of course you could calculate a field if you wanted one to record 'yes' or 'no' (true or false) whether the result meets your criteria.
Sound on course so far??
10-07-2013
05:38 AM
- Mark as New
- Bookmark
- Subscribe
- Mute
- Subscribe to RSS Feed
- Permalink
Hi,
Yes that's what I am looking for
Thanks
Yes that's what I am looking for
Thanks
10-07-2013
06:23 AM
- Mark as New
- Bookmark
- Subscribe
- Mute
- Subscribe to RSS Feed
- Permalink
So, if your data is what I think it is, you could select the records for the single type you want to run the calculation against, from the open table right-click on the area field and get the summary stats (this dynamic tool is denoted by the sigma sign, I believe), so that (if you don't already have the sum figure) you will then have a sum of the area of those selected records.
You could copy this figure, create a new numeric field and (conceivably) calculate the division by 'hard-coding' this value in the field calculator expression. Of course it is not necessary to calculate the records from which you got the sum figure, so you could 'switch selection' before you run the calc. Make sense?
It may help if you attach a more representative table of your data...
Hope that helps.
Wayne
10-07-2013
04:11 PM
- Mark as New
- Bookmark
- Subscribe
- Mute
- Subscribe to RSS Feed
- Permalink
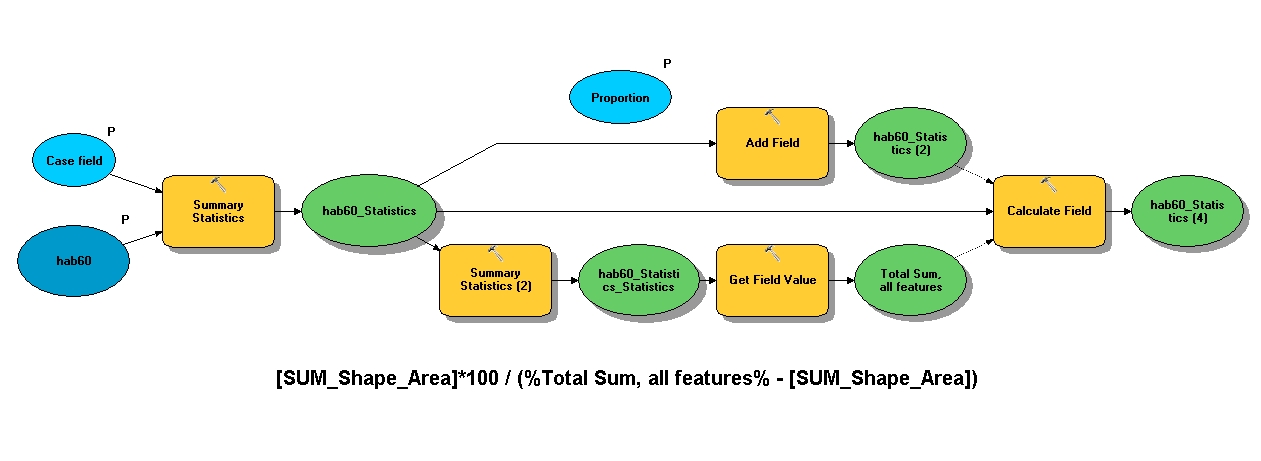
Mark, I was very much interested in how you could do this without scripting and without any of the advanced tools -- and after I read your posts today, I think there's a fairly direct solution with a model (ModelBuilder). See this graphic first:
[ATTACH=CONFIG]28105[/ATTACH]
Now let me make sure I understand what basic proportion figure you want - is it correct that for every summary value by type, you want to compare this value with the remaining values, ie divide by the sum of the remaining values? (Then, of course, if that is the case multiplying by 100 yields percentage.)
I'm not very good with ModelBuilder but managed to put together in 10.1 a model with a companion map and file gdb, everything is relative-pathed, so you should be able to save the zip to your local drive somewhere, open the map provided and run the model - you should be able to open the model in edit mode to see how it works. If for some reason it doesn't work or not as expected, let me know. For me, it was mainly a matter of understanding how ModelBuilder handles model params and in-line variable substitution.
Any questions, please fire away. The expression which I placed as a label at the bottom of the graphic is, I suppose, the most important part...the Get Value tool was interesting, a little trick on the 2nd summary stat execution to simply fetch the grand total area value of the single output record. I guess not everything had to be a 'hard output' to the gdb provided, but maybe helps to see what's going on. The hab60 is a provided input layer with a Type1 field - this is summarized out to 3 types to sum polygon areas (you can adapt it very easily to line lengths). The 2nd summary already mentioned is for the total - Calculate Value or Calculate Field with a python expression could have done this too, but my objective was to either do it all in Python or all in ModelBuilder ---- because I'm a glutton for punishment I suppose. (Just kidding, I just didn't want to unnecessarily introduce any Python in this forum.)
Hope that helps, certainly I needed a better handle on in-line var sub - and also the ability to troubleshoot better some, well, monstrous models....perhaps?
Sorry, didn't include a ReadMe file...if you really need one I'll see what I can do. It appears the initial attachment was too large, it was the gdb, so I've greatly reduced it, and it successfully uploaded. The added 'test' field in the summary table added to the TOC of the map should result in the 3 records where the added field is updated (the overwrite property in Geoprocessing Options should be turned on) --- results (in percent) may be a little ridiculous, but accurate given the sample set.
Enjoy,
Wayne
10-08-2013
03:12 AM
- Mark as New
- Bookmark
- Subscribe
- Mute
- Subscribe to RSS Feed
- Permalink
Hi,
Thank you very much for all your help. I took your model and customised it for my needs. Instead of using the stats tool I used the dissolve tool as I need to create a spatial table rather than just a 'flat' table. One difficulty I had was how to join the two tables. I overcame this by cheating a bit. I simply assigned a new field to the nonA1 use class table and calculated the value to be A1 just to join the table. I could then run field calculations based on fields within the same table. (the end user does not see this processing)
I also added in a field to say if the result of the non A1 use class is more or less than 20% of the A1 Value
If [SUM_SHAPE_Length] < [Non_A1_Percentage] Then
Output = "Less Than 20%"
ElseIf [SUM_SHAPE_Length] > [Non_A1_Percentage] Then
Output = "More Than 20%"
End If
Results=
Output
My model is probably not the slickest but it gets the job done and I have attached as a graphic.
Again thank you (and to others) for all your help with this as it automates a large part of the end users' task.
Mark
[ATTACH=CONFIG]28112[/ATTACH]
- « Previous
-
- 1
- 2
- Next »
- « Previous
-
- 1
- 2
- Next »