- Home
- :
- All Communities
- :
- Industries
- :
- Natural Resources
- :
- Forestry
- :
- Forestry Questions
- :
- Re: ArcMAP Symbology
- Subscribe to RSS Feed
- Mark Topic as New
- Mark Topic as Read
- Float this Topic for Current User
- Bookmark
- Subscribe
- Mute
- Printer Friendly Page
- Mark as New
- Bookmark
- Subscribe
- Mute
- Subscribe to RSS Feed
- Permalink
Hello,
This is an ArcMAP 10.4.1 question. Is it possible to symbolize using one value field; then color and size that symbol using another field? I am trying to display a set of surface geochem data. I would like to choose a different symbol for each rock type then color and size that symbol depending on its gold value. So far I am able to symbolize each rock type differently and size each symbol according to its gold value, but I am not able to choose different colors for the increasing gold values. I am using the multiple attributes function in symbology.
Thanks
Ryan
Solved! Go to Solution.
Accepted Solutions
- Mark as New
- Bookmark
- Subscribe
- Mute
- Subscribe to RSS Feed
- Permalink
OK, so I think it will be possible, but it will require some manual configuration:

I generated a random dataset with this structure:
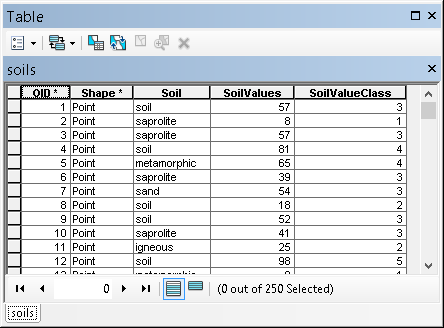
The SoilValueClass is a classification of the SoilValues into 5 classes.
I used two field as Value fields (Soil and SoilValueClass):

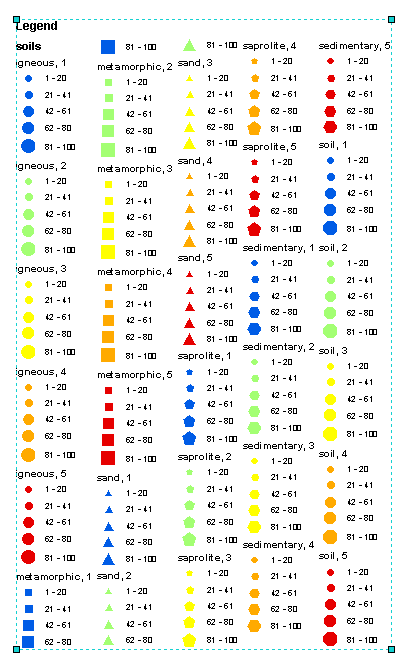
I manually assigned the colors, since applying the ramp will assign blue to "igneous, 1" and red to the end "Soil, 5" which is not what you want. So I selected "igneous, 1", "metamorphic,1", etc up to "soil, 1" and assigned the blue color and for every "SoilValueClass" value a different color in the range of blue to red.
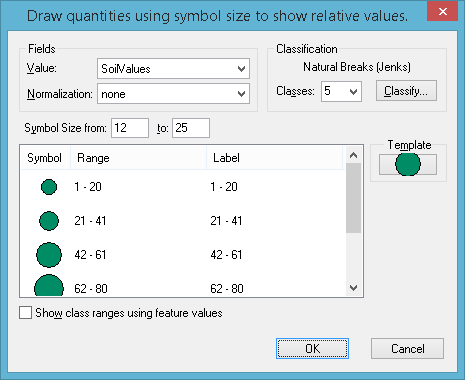
The Symbol Size was defined by the field SoilValues:
The legend is very, very, very long...
- Mark as New
- Bookmark
- Subscribe
- Mute
- Subscribe to RSS Feed
- Permalink
What is your layer geometry type ? ( point or polygon?)
- Mark as New
- Bookmark
- Subscribe
- Mute
- Subscribe to RSS Feed
- Permalink
Point
- Mark as New
- Bookmark
- Subscribe
- Mute
- Subscribe to RSS Feed
- Permalink
Have you tried Drawing features to show quantity by category—Help | ArcGIS Desktop ? If so, what did you try, specifically, and what results were you getting relative to expecting?
- Mark as New
- Bookmark
- Subscribe
- Mute
- Subscribe to RSS Feed
- Permalink
Yes, I did try using the categories section but that section does not include the symbol size feature like the multiple attributes section does.
- Mark as New
- Bookmark
- Subscribe
- Mute
- Subscribe to RSS Feed
- Permalink
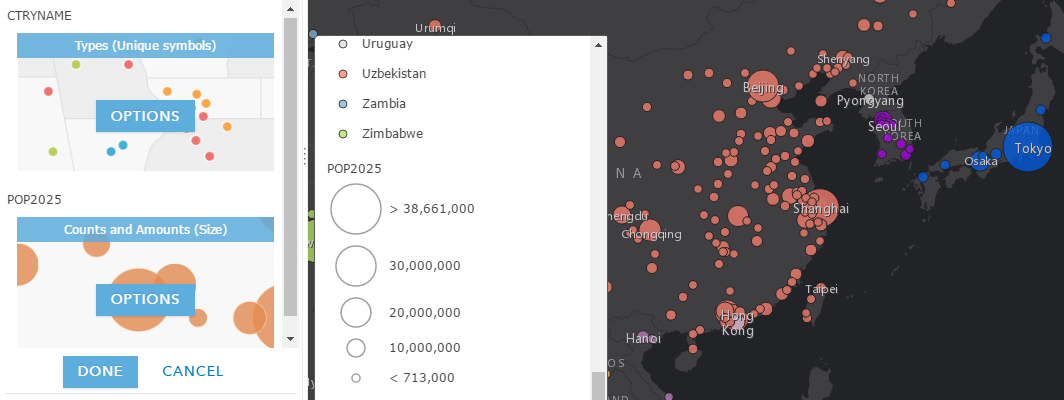
To bad that you are not using ArcGIS Pro. In ArcGIS Pro this is standard functionality: using 1 attribute for size and the second for color...

... and also ArcGIS Online (ArcGIS Mapping Made Easy) does support this:
.
- Mark as New
- Bookmark
- Subscribe
- Mute
- Subscribe to RSS Feed
- Permalink
OK, so maybe it is possible without too much manual stuff in ArcMap.
If both your attributes are continuous values, you could create a new field and fill that with the classification of the field you want to use to define the colors. In my example below this would be the field "ClassAttr1". Select the "Quantity by category" option in "Multiple Attributes", select the ClassAttr1 field as the only Value field and select the appropriate color ramp... and add all values
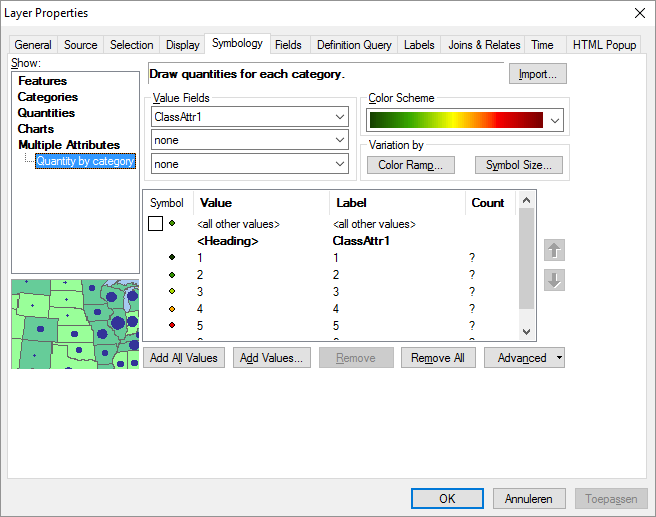
Next select the Symbol Size button and select the other attribute that contains the values for the size of the symbol:
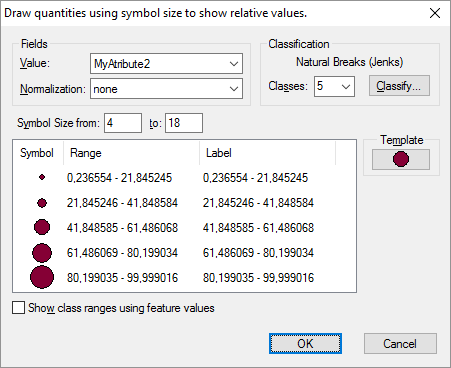
Hit OK twice and you will get symbols colored by one attribute and sized defined by the second attribute:

- Mark as New
- Bookmark
- Subscribe
- Mute
- Subscribe to RSS Feed
- Permalink
Thanks Xander,
Using this approach would definitely display the data enough to get my point across, but can you think of a way to use different symbols for the values of "ClassAttr1", then have the color (blue low values to red high values) and size increase according to "Myattribute2". I tried changing the colors in the symbol size feature to no avail. I think displaying the data how I have described would get my point across pretty nicely.
Thanks again,
Ryan
- Mark as New
- Bookmark
- Subscribe
- Mute
- Subscribe to RSS Feed
- Permalink
If I understand this correctly, You would be using the same attribute for both color and size. To do this, you would still need an additional field that contains the classification of that attribute and use that field for displaying the colors with a ramp that has colors fading from blue to red and use the original values to define the size. Is that what you are after? Is it possible to share a sample of your data to have a look if that works?
- Mark as New
- Bookmark
- Subscribe
- Mute
- Subscribe to RSS Feed
- Permalink
The images above show my current setup in symbology and how they are being displayed. I basically just need all the different symbols to change color with increasing values like I have shown in the symbol size window. So, I accomplished two out of the three goals. 1. Give different symbols for each rock type. 2. show increasing size symbols for higher values. 3. have different colors for increasing values. FAILED.
The third goal was not accomplished. Unfortunately, I am not able to share any of this data. But any assistance would be appreciated.
Thanks