- Home
- :
- All Communities
- :
- Services
- :
- Esri Training
- :
- Esri Training Questions
- :
- Re: May 15, 2018: Cartography. MOOC Ask Me Anythin...
- Subscribe to RSS Feed
- Mark Topic as New
- Mark Topic as Read
- Float this Topic for Current User
- Bookmark
- Subscribe
- Mute
- Printer Friendly Page
May 15, 2018: Cartography. MOOC Ask Me Anything (AMA)
- Mark as New
- Bookmark
- Subscribe
- Mute
- Subscribe to RSS Feed
- Permalink
- Report Inappropriate Content
Live Today! AMA Event on GeoNet
Tuesday, May 15, 9:30 a.m. - 10:30 a.m. (PDT)
Join our Cartography. MOOC guests here on the GeoNet Community for a LIVE AMA (Ask Me Anything) event. The AMA will take place in this discussion thread on Tuesday, May 15, 2018, from 9:30 a.m. - 10:30 a.m. (PDT).
*Click HERE to convert exact time for different countries.
This is an opportunity to ask our guests questions about the Cartography. MOOC course, about cartography in general, great maps, best practices or anything else that comes to mind.
AMA Guests
How does the AMA work? During the AMA, you can post your questions by clicking the "Add Reply" button below and our guests will reply to your questions in comments. You are welcome to post questions ahead of the AMA and they will answer them during the AMA.Please note: You must be logged in to post questions and see responses. See instructions on How to Log into GeoNet for the AMA. AMA Tips and GeoNet Community Guidelines
- When asking questions and comments during the AMA, remember to follow the GeoNet Community Guiding Principles: Be Helpful, Be Human, Be Smart.
- This discussion page will not auto-refresh, so please remember to refresh this page to see new questions, comments and replies.
Please note: The AMA will be live when you see a picture of our guests below. We are live!
 |  |
9:30 a.m. - And we're live! Go ahead and ask your questions!
9:45 a.m. - If you are just joining us, feel free to ask any question.
10:00 a.m. - We're halfway through, Great questions! Keep them coming!
10:15 a.m. - If you are just joining us, feel free to ask any question.
10:25 a.m. - Five minutes to go! Got any fun questions for our Guests?
10:30 a.m. - And that's a wrap! The live AMA has ended with our wonderful Cartography. MOOC Guests.
Thank you for your questions and participation.
The thread has shifted to a time-stamp view. To view the threads in their entirety, you can select the Actions above the right corner of the discussion thread and select View PDF.
- Mark as New
- Bookmark
- Subscribe
- Mute
- Subscribe to RSS Feed
- Permalink
- Report Inappropriate Content
Hey Patrick,
Yes, we are building up a library of styles. You can see them here: https://esri-styles.maps.arcgis.com/home/index.html
When you're in ArcGIS pro, you can search All Portal for "stylx" and you'll find them. We're always working to build more styles, and happy to take suggestions.
Edie
- Mark as New
- Bookmark
- Subscribe
- Mute
- Subscribe to RSS Feed
- Permalink
- Report Inappropriate Content
You should check out the Cartographers Guild.... those guys do lots of antique maps along with fantasy and other.
- Mark as New
- Bookmark
- Subscribe
- Mute
- Subscribe to RSS Feed
- Permalink
- Report Inappropriate Content
For sure! That page is so inspiring. I like the twitter feed of sweetness they pour out into the world... Cartographers' Guild (@CartoGuild) | Twitter
- Mark as New
- Bookmark
- Subscribe
- Mute
- Subscribe to RSS Feed
- Permalink
- Report Inappropriate Content
Dear Team,
Thanks a lot for this amazing course. I love it.
I have a question regarding the 3D labels. Using ArcGIS Pro scene view, how can I elevate the labels in a 3D environment and add a leader line to it similar to the sample you showed in the video. I attached a screen shot below...
I tried the offset settings for the label and all possible parameters with no luck...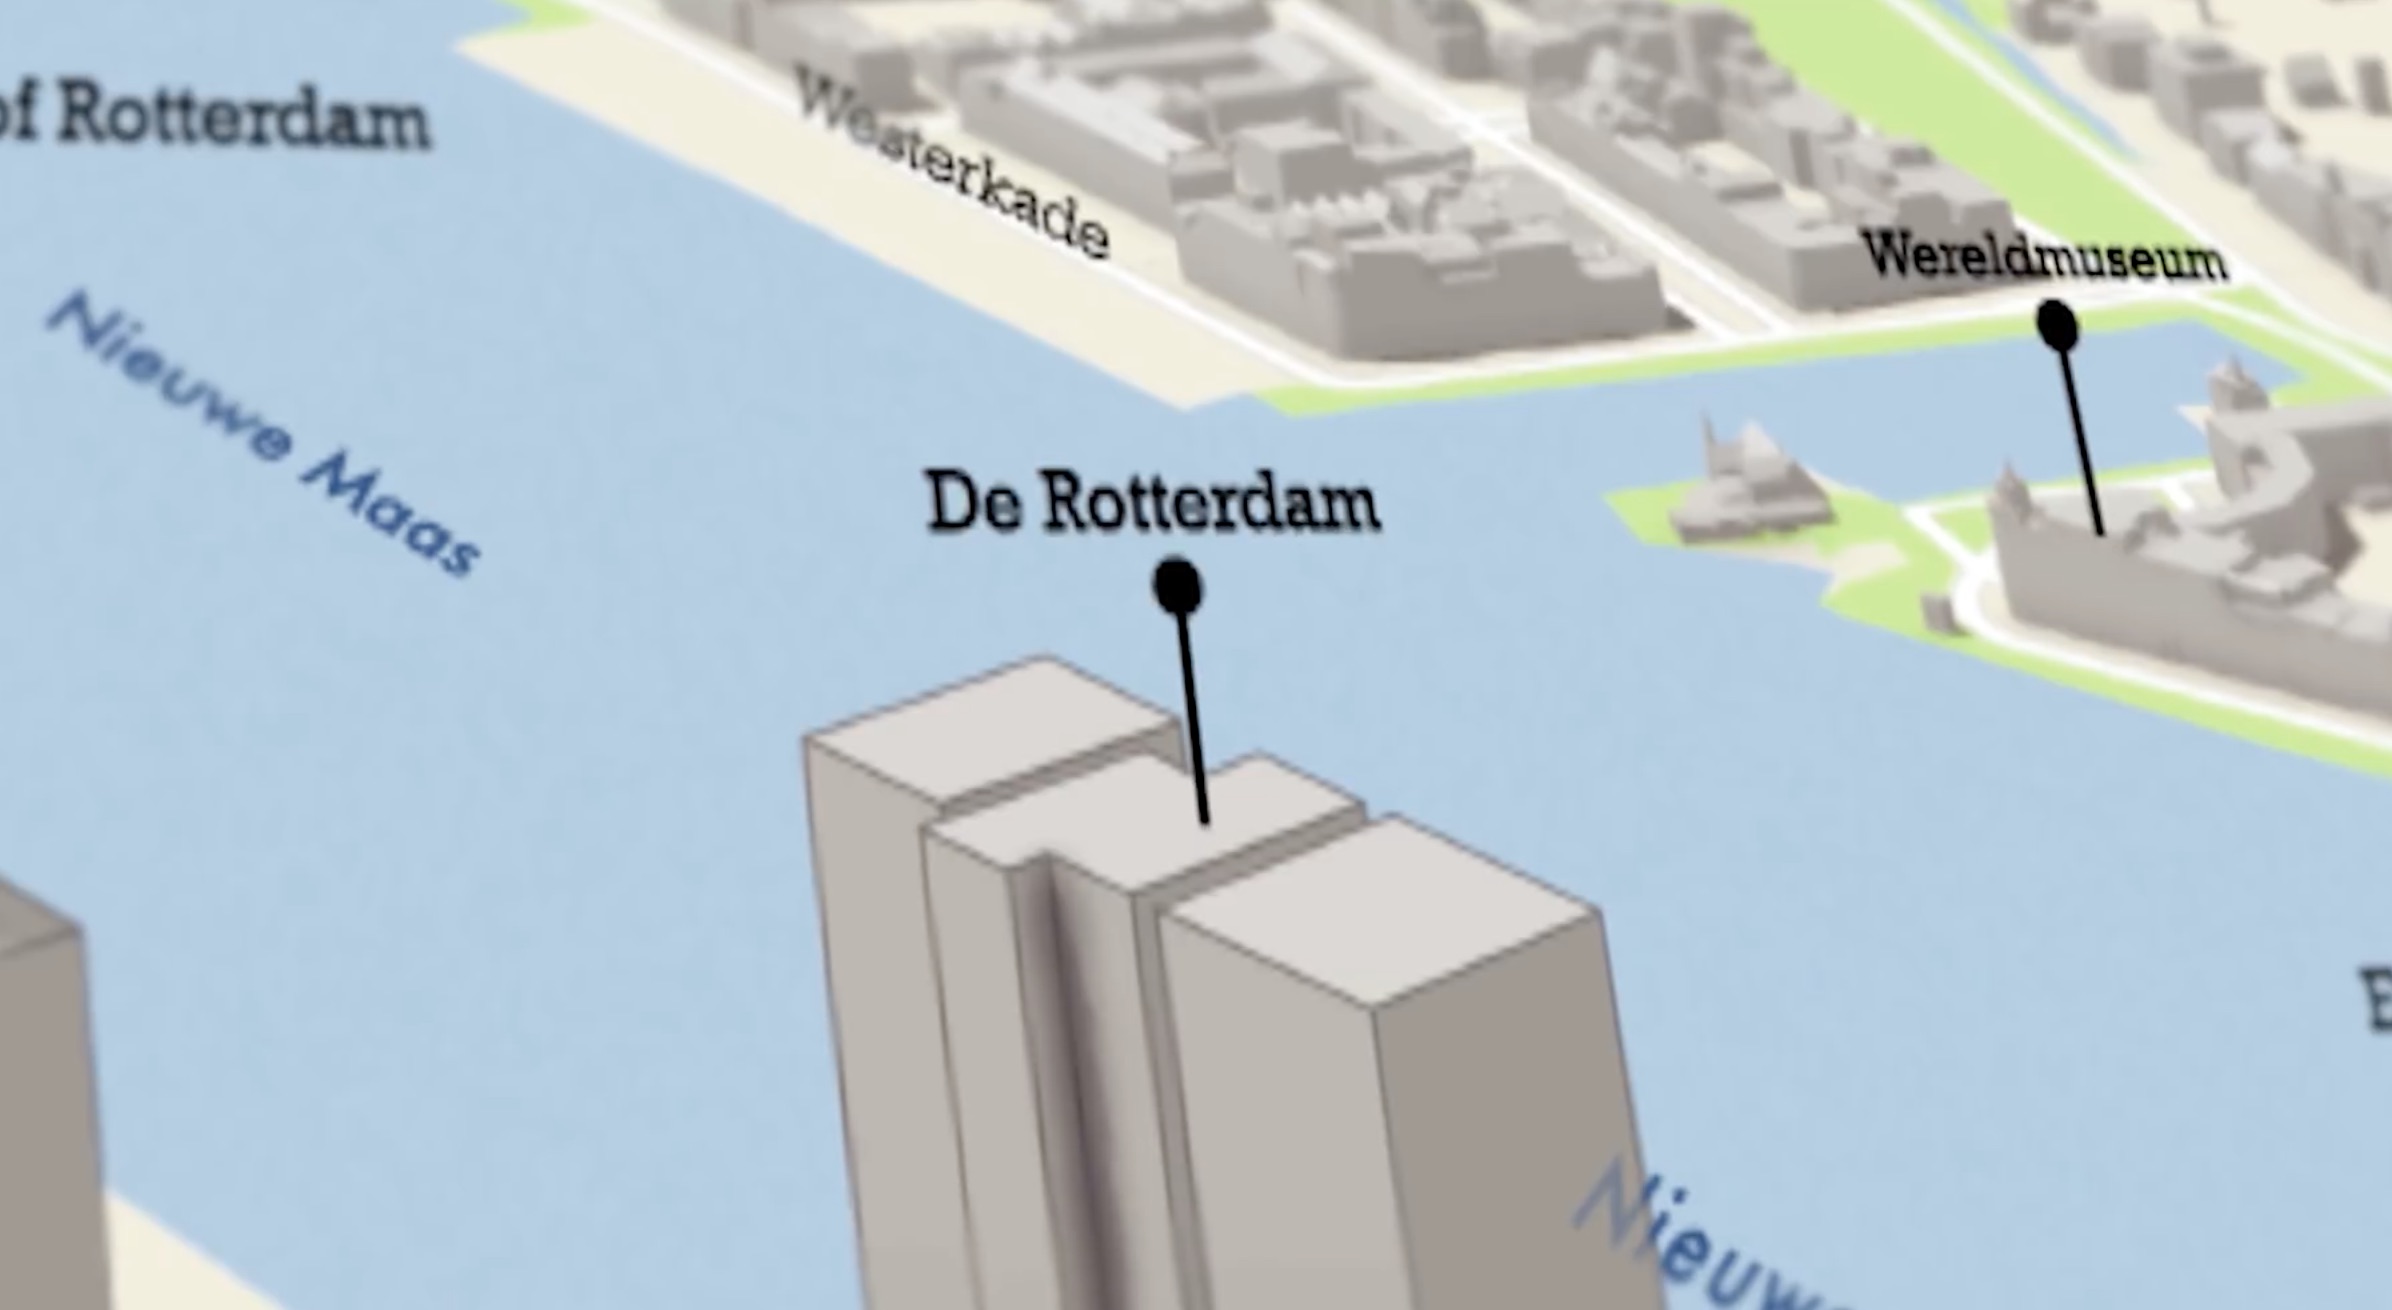
- Mark as New
- Bookmark
- Subscribe
- Mute
- Subscribe to RSS Feed
- Permalink
- Report Inappropriate Content
Hi Pakrad,
We have limited options for 3D labeling in Pro at the moment, but we're looking to improve that soon.
For the above screenshot, it looks like a "trick" is being used. Here's a workflow that will likely work:
- Create point features for the label points
- They'll need to be z-aware, and make sure they're above the features they're labelling
- Symbolize them with a pushpin symbol (search for "pushpin" in the gallery)
- Label the point feature with the "top of point" option
Hope this helps!
-Nathan.
- Mark as New
- Bookmark
- Subscribe
- Mute
- Subscribe to RSS Feed
- Permalink
- Report Inappropriate Content
Hi: I'll add to the chorus of "great mooc!" Thanks for putting this together -- my aesthetic eye has never been great and this is helping me.
On the first hurricane map, I thought it would be cool to do a color ramp of the points by data in, I dunno, 20 year increments. Alas, after fooling around for awhile I couldn't figure out how to assign different color (aka colour) by a date range. I suspect it's pretty easy but I ran out of time. Helpful hint??
Grazie!
- Mark as New
- Bookmark
- Subscribe
- Mute
- Subscribe to RSS Feed
- Permalink
- Report Inappropriate Content
Thanks George! Cool idea. I did an animated version where I played through each year. Sort of that idea. But there are so many cool things you can do with visualizing time slices.
- Mark as New
- Bookmark
- Subscribe
- Mute
- Subscribe to RSS Feed
- Permalink
- Report Inappropriate Content
John, thanks. Could you or crew suggest a workflow to start. I like animated but the first step would be to divide the points by year then assign a color to each year. Even that step I had problem with. Can a color ramp be assigned to points? I'd got back and fiddle around (endlessly...) and likely eventually figure it out but you guys are here now! Any help appreciated!
- Mark as New
- Bookmark
- Subscribe
- Mute
- Subscribe to RSS Feed
- Permalink
- Report Inappropriate Content
You should be able to do it with an Arcade expression --> the different between the field-value and the max date value. Or you can create a new dedicated field (in the feature class) and calculate a value using the same technique - eg: number of days since the earliest date.
Then use a continuous color scheme for the change through time.
Lots of options! Sounds like it could be pretty cool.
-Nathan.
- Mark as New
- Bookmark
- Subscribe
- Mute
- Subscribe to RSS Feed
- Permalink
- Report Inappropriate Content
Great MOOC guys even though the dog keeps eating my homework every week.
I have some 100M GRID data with a population value. I have it open in ArcGIS Pro. How can I "extrude" the surface to show population in the Z-axis?