- Home
- :
- All Communities
- :
- User Groups
- :
- Elevation Data
- :
- Questions
- :
- Re: New to ArcMap - Contours from .sid?
- Subscribe to RSS Feed
- Mark Topic as New
- Mark Topic as Read
- Float this Topic for Current User
- Bookmark
- Subscribe
- Mute
- Printer Friendly Page
- Mark as New
- Bookmark
- Subscribe
- Mute
- Subscribe to RSS Feed
- Permalink
First, this whole query will probably seem pretty ignorant - I am a new user but I cannot find a specific answer to what I want so I decided to ask.
I downloaded some elevation data for a couple of counties from here: Data Download | TNRIS - Texas Natural Resources Information System
What I got for adding to my ArcMap project was a .shp file that seems to just be solid bands across the area and a .sid with band_1, band_2 and band_3 to add.
My goal: making a contour map of the area
My questions:
1. What is this shapefile? Do I even need it?
2. I found that the .sid is a "Seamless Image Database" but what are these three bands? They seem identical to me. Do I need all three?
And finally,
3. If I have these elevation files for 4 adjoining counties (with some overlapping area), can I merge them all together so that I can contour the entire zone? And if so, how?
Thank you for any help.
I've attached a screenshot of the area I am talking about (only 2 of the counties have been added so far) to make the question more visual, if that helps. It shows the three bands and the shapefile (just a hollow outline in the screenshot) under each county.
Solved! Go to Solution.
Accepted Solutions
- Mark as New
- Bookmark
- Subscribe
- Mute
- Subscribe to RSS Feed
- Permalink
I'm not sure you downloaded elevation data.
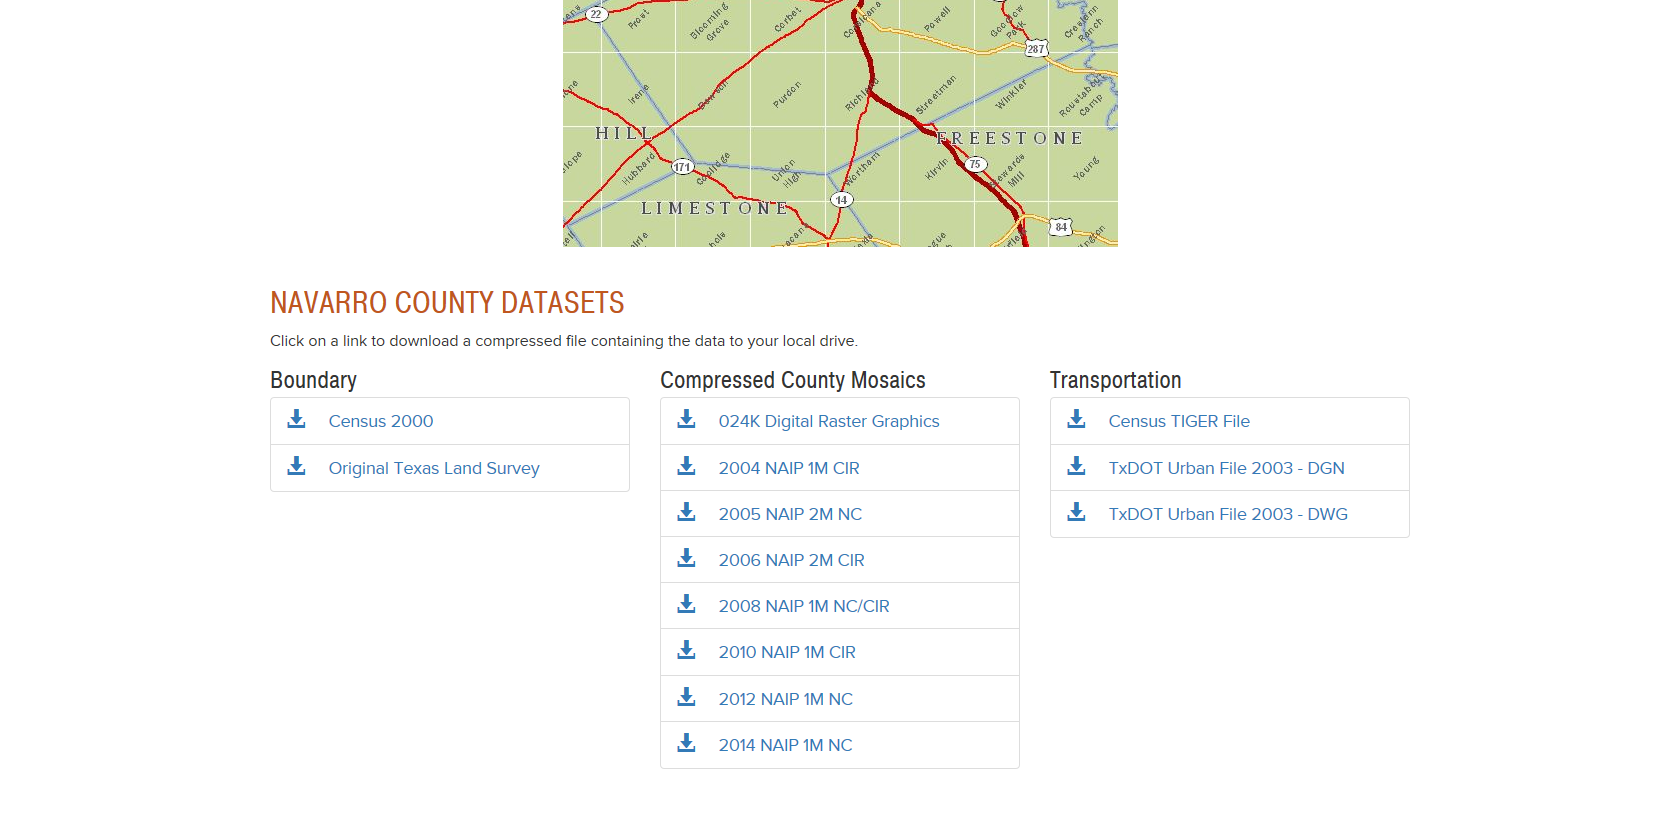
From your screenshot you grabbed 2014 NAIP 1M NC, which is USDA RGB NAIP Imagery, not elevation data. The boundaries you downloaded are county boundaries it looks like.
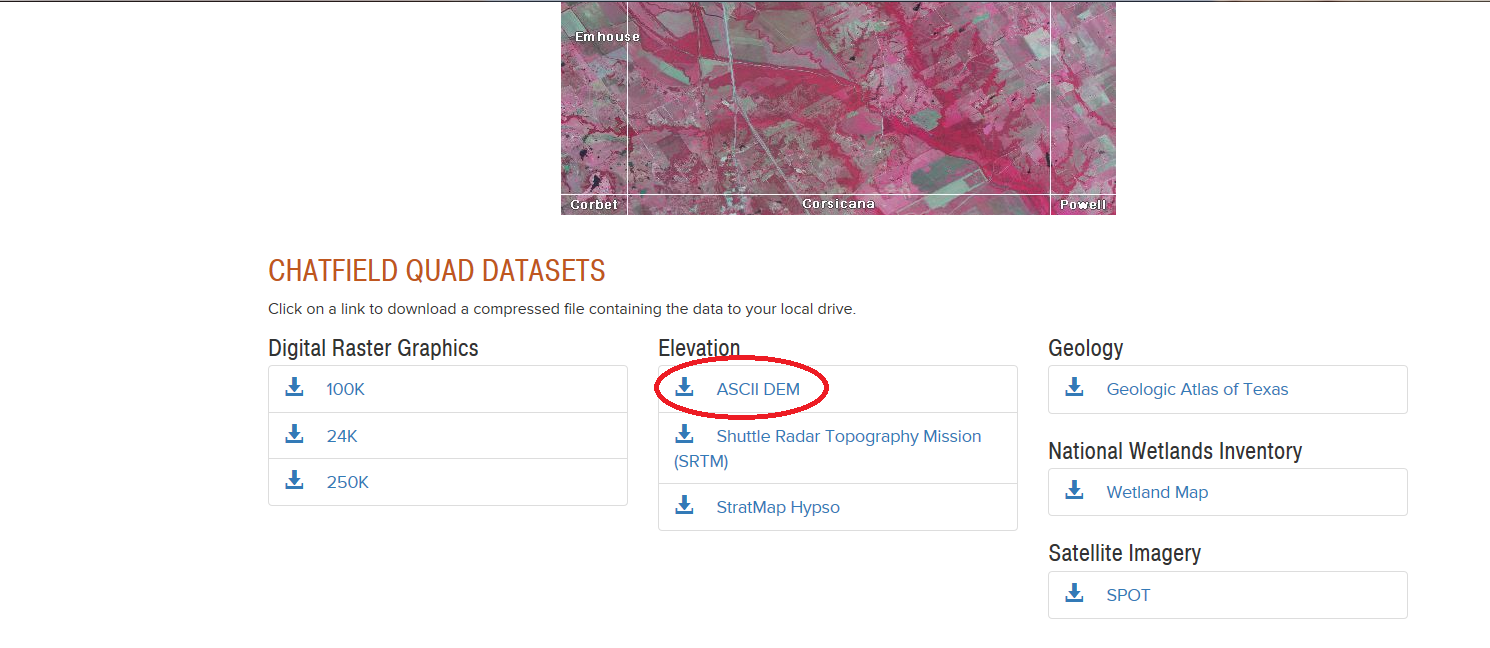
I could only find downloads for elevation data "ASCII DEM" (Digital Elevation Models) on a quadrangle basis.
Once you get all your rasters together, you can Mosaic them all together ArcGIS Help 10.1 or create a Mosaic Dataset ArcGIS Help 10.1 to combine all your rasters and generate contours from them.
- Mark as New
- Bookmark
- Subscribe
- Mute
- Subscribe to RSS Feed
- Permalink
I'm not sure you downloaded elevation data.
From your screenshot you grabbed 2014 NAIP 1M NC, which is USDA RGB NAIP Imagery, not elevation data. The boundaries you downloaded are county boundaries it looks like.
I could only find downloads for elevation data "ASCII DEM" (Digital Elevation Models) on a quadrangle basis.
Once you get all your rasters together, you can Mosaic them all together ArcGIS Help 10.1 or create a Mosaic Dataset ArcGIS Help 10.1 to combine all your rasters and generate contours from them.