- Home
- :
- All Communities
- :
- Developers
- :
- Developers - General
- :
- Developers Questions
- :
- Related Table's Pop-Up and Chart graph on Date att...
- Subscribe to RSS Feed
- Mark Topic as New
- Mark Topic as Read
- Float this Topic for Current User
- Bookmark
- Subscribe
- Mute
- Printer Friendly Page
Related Table's Pop-Up and Chart graph on Date attributes in AGOL
- Mark as New
- Bookmark
- Subscribe
- Mute
- Subscribe to RSS Feed
- Permalink
I have a point feature class with related table saved in AGOL that has historic surveyed values with a date field.
I've been configuring the pop-up to show the numeric values in related table as a line chart media, and faced with two issues.
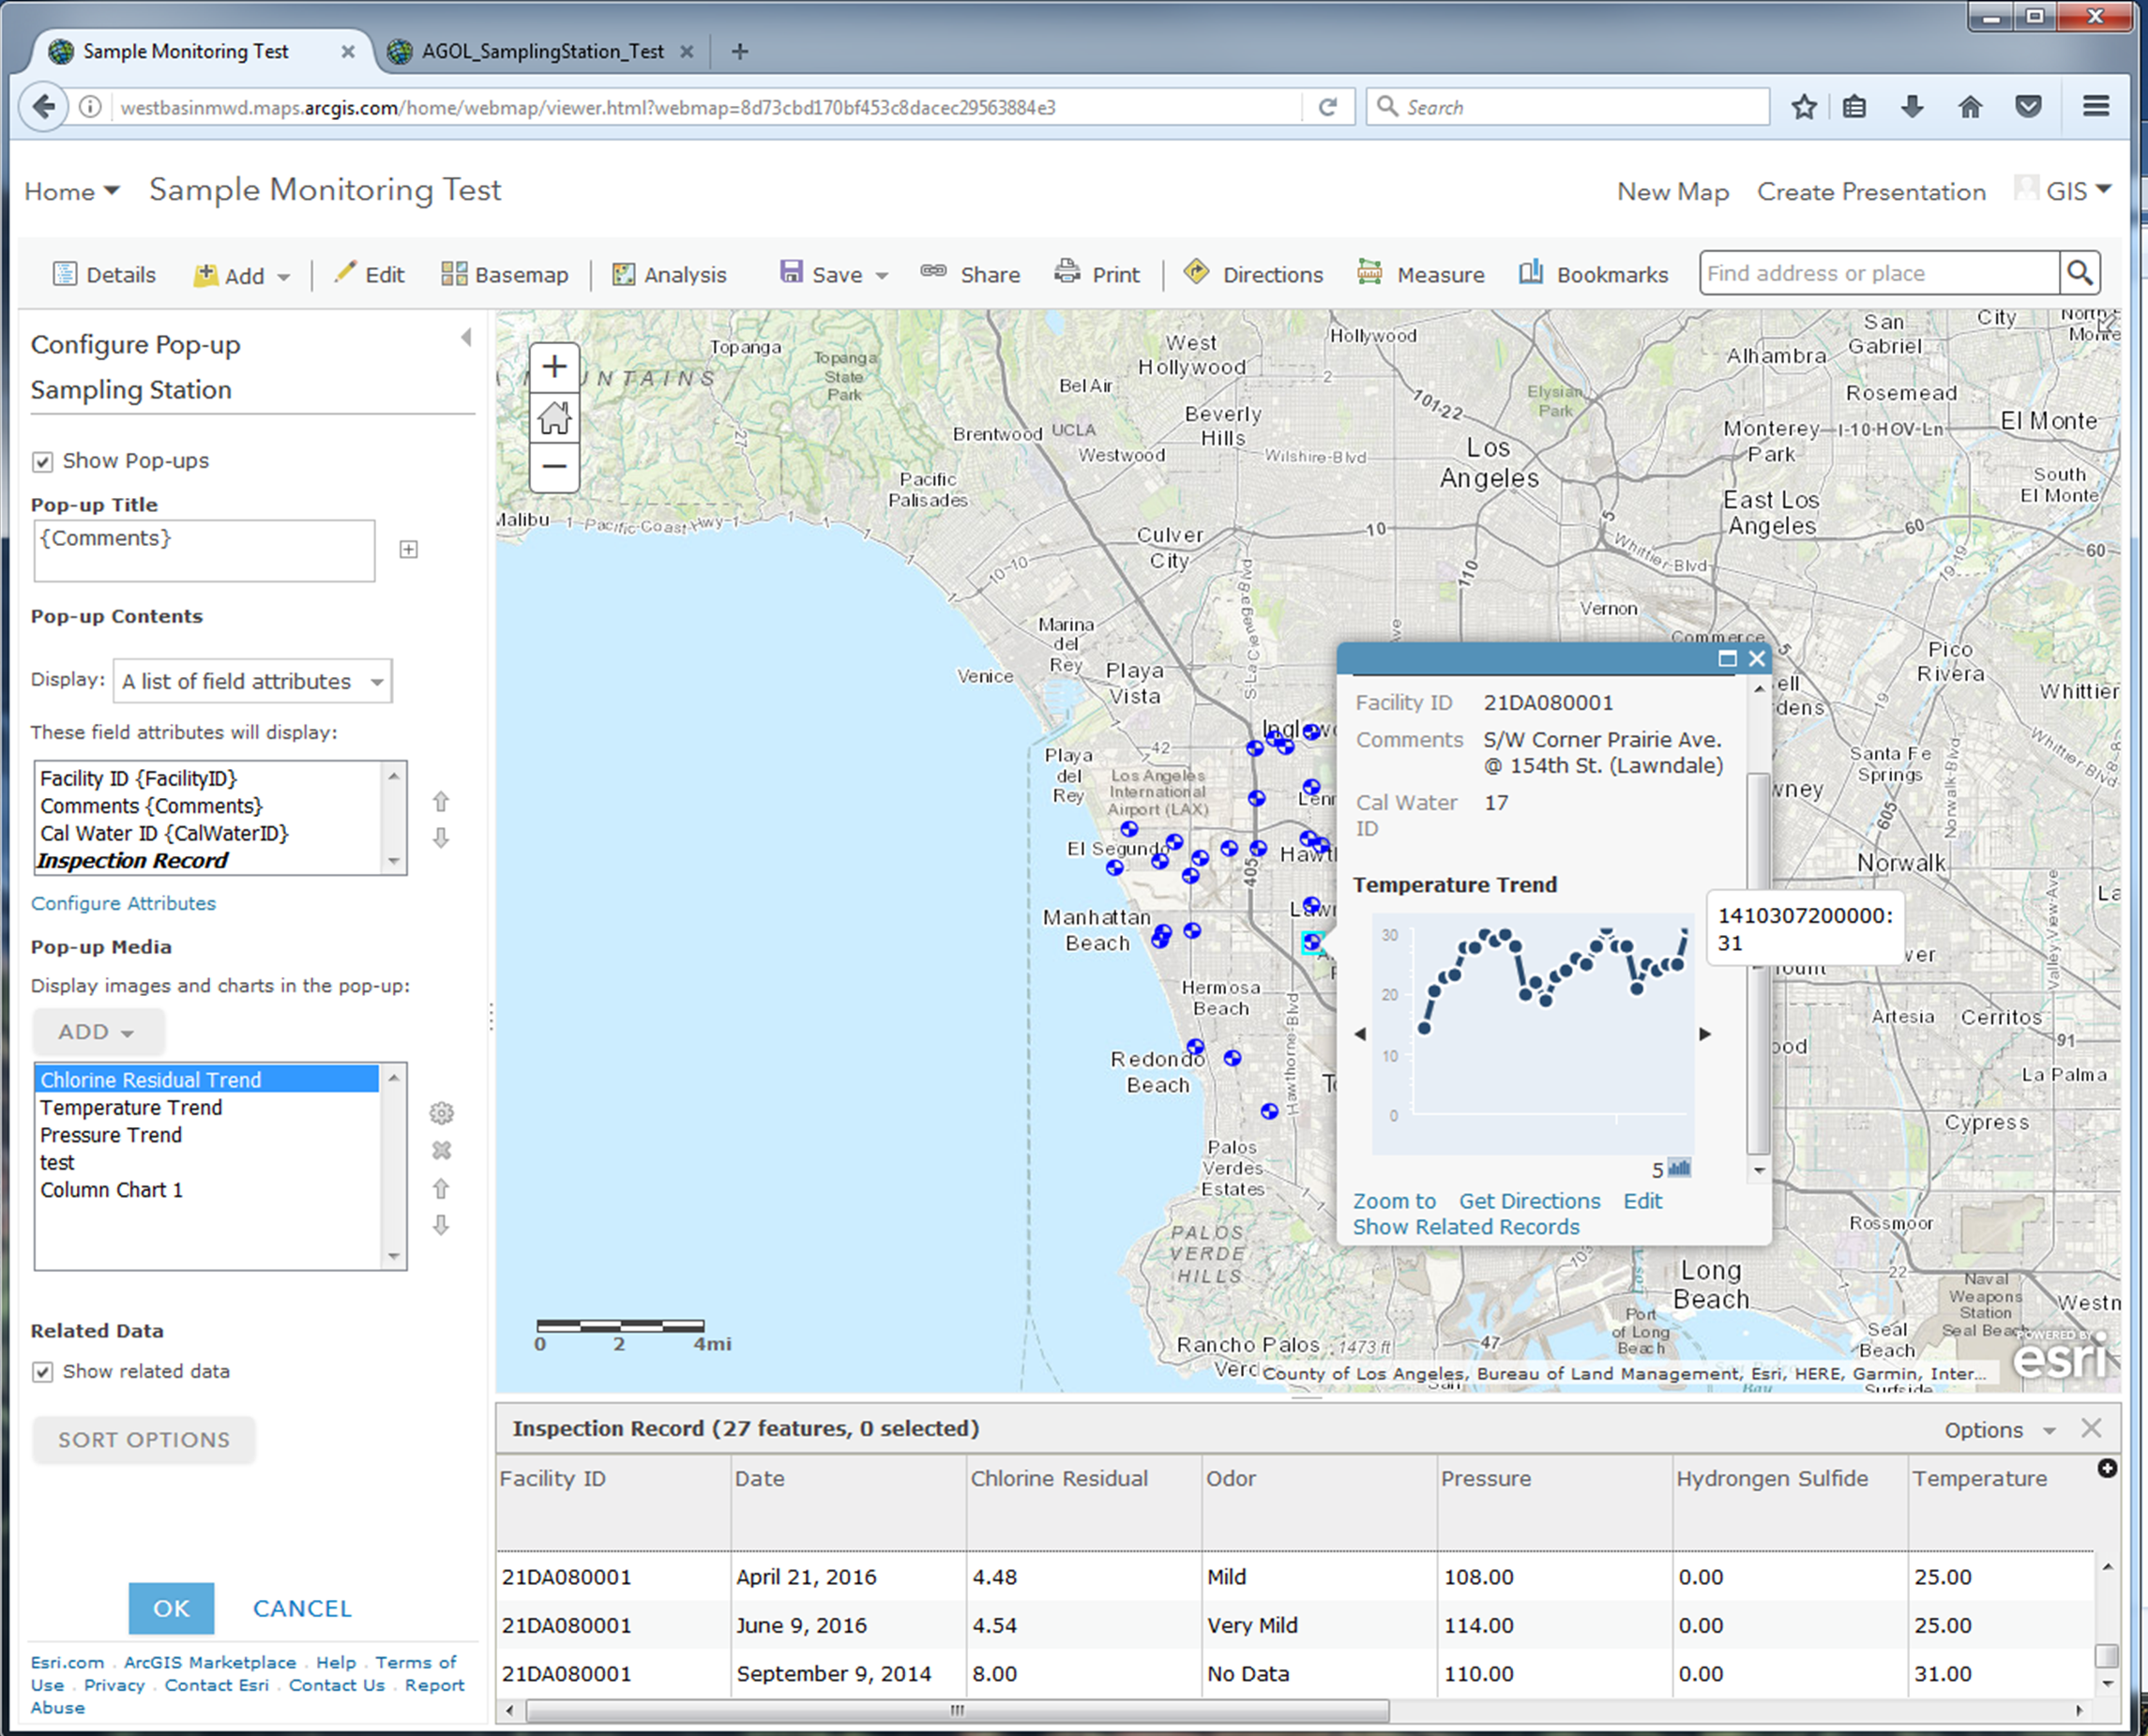
- Date Field cannot be configured to ascending/descending order when designing the chart.
Is there a way to configure the related table's date field to show the chart in temporal manner?
As you can see in records, the dates are not in order and the chart can be misleading - Date Field displays as 13-digit numeric values when the mouse hovers
When a mouse hovers on a chart, the value "September 9, 2014" displays as "1410307200000"
Any suggestions or guidance would be grateful.
- Mark as New
- Bookmark
- Subscribe
- Mute
- Subscribe to RSS Feed
- Permalink
I have the same exact issue. Many of my dataset are time series. This type of one (feature) to many (records) data is norm in scientific communities; however, both chart and related chart widget do not seem to support it. Both axis are not configurable and x-axis label is not even displayable.
Geospatial Data Scientist/Developer - Geographical Information Platform
Global Power Generation - Digital Satellite USA and Canada
- Mark as New
- Bookmark
- Subscribe
- Mute
- Subscribe to RSS Feed
- Permalink
I know it's been a long time since I've post this.
I took the issues to the User Conference, and I spoke with AGOL engineers and other staffs.
Esri technician acknowledged the problem of non-chronological order and the incorrect time label, and issued the tickets.
We might have to wait little longer to get those enhancements though.
- Mark as New
- Bookmark
- Subscribe
- Mute
- Subscribe to RSS Feed
- Permalink
Did you ever have an issue with the pop up charting the wrong field? My map keeps defaulting back to the same attribute field that I do not want to chart.
- Mark as New
- Bookmark
- Subscribe
- Mute
- Subscribe to RSS Feed
- Permalink
Did you find a solution for the defaulting back issue? I experience the same thing and the Chart functionality to related tables becomes somewhat useless? 😕
- Mark as New
- Bookmark
- Subscribe
- Mute
- Subscribe to RSS Feed
- Permalink
I also have this issue. were either of you ever able to figure out a way to make data appear chronologically or did esri come up with a solution?
- Mark as New
- Bookmark
- Subscribe
- Mute
- Subscribe to RSS Feed
- Permalink
Same issue here. . . any update on this ticket?
- Mark as New
- Bookmark
- Subscribe
- Mute
- Subscribe to RSS Feed
- Permalink
A work around would be to create the graph with a different application and then add it as an image to the pop-up (same place as you add the chart). Not great, but I'm considering it.