- Home
- :
- All Communities
- :
- Products
- :
- Data Management
- :
- Data Management Questions
- :
- Re: Why does quantities graduated colors show diff...
- Subscribe to RSS Feed
- Mark Topic as New
- Mark Topic as Read
- Float this Topic for Current User
- Bookmark
- Subscribe
- Mute
- Printer Friendly Page
Why does quantities graduated colors show different values?
- Mark as New
- Bookmark
- Subscribe
- Mute
- Subscribe to RSS Feed
- Permalink
I am currently working on a heatmap and trying different ways of visualizing my data. I used unique values in combination with labels which worked fine.
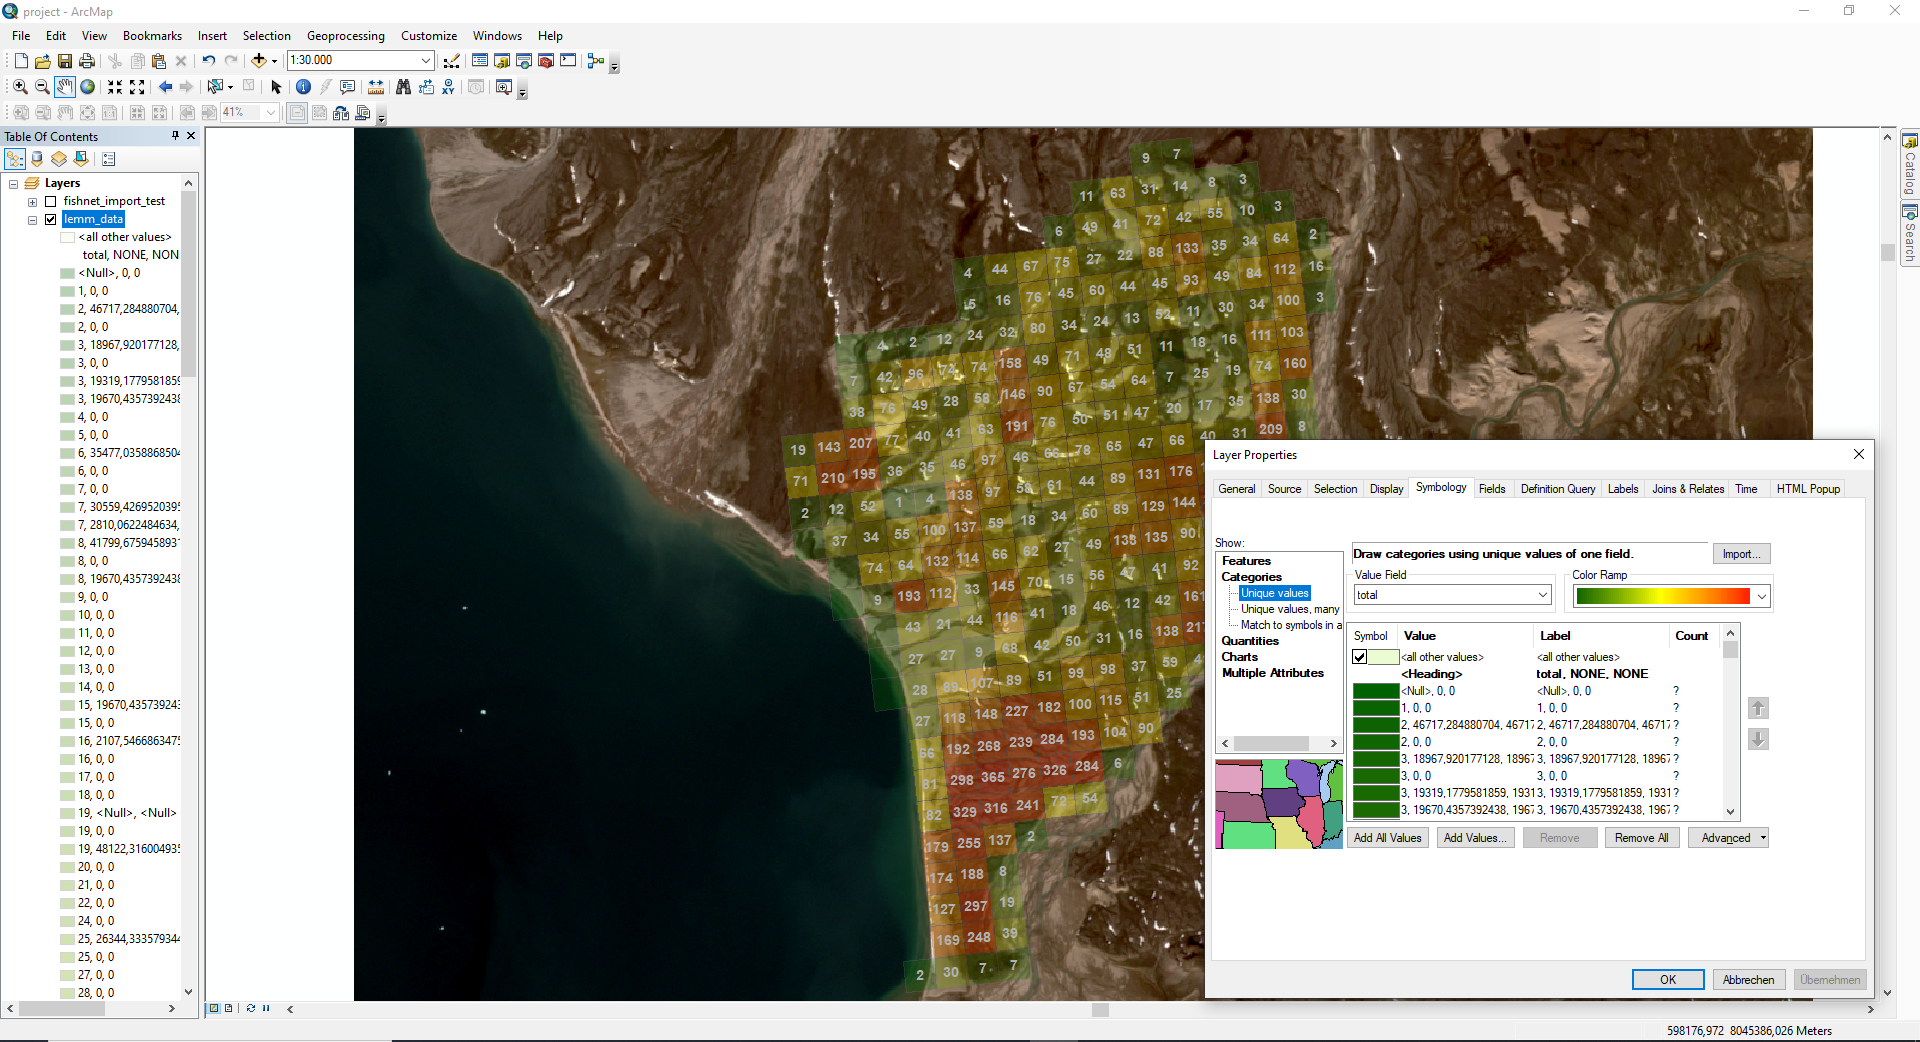
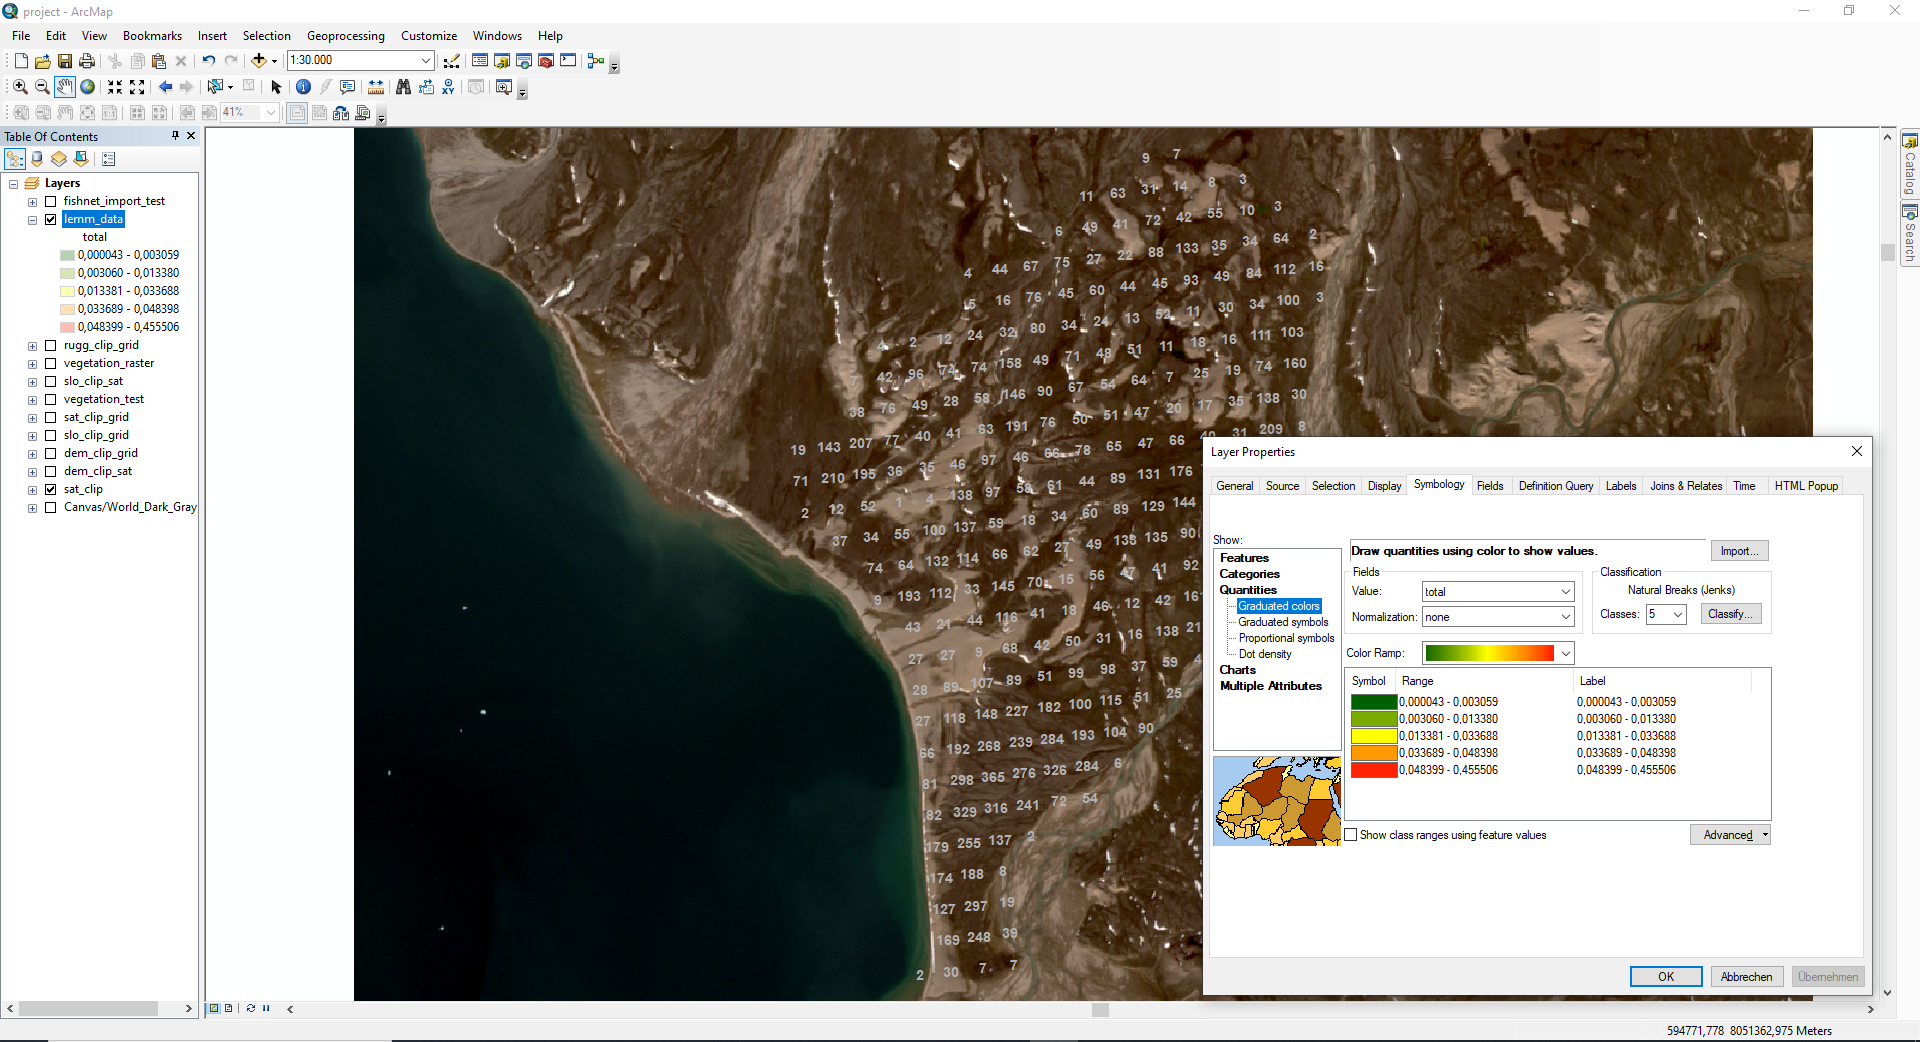
However, it may be to confusing for a research paper and and I decided to use quantities instead. Unfortunately, using the same value I get very strange numbers that are not present in my dataset.
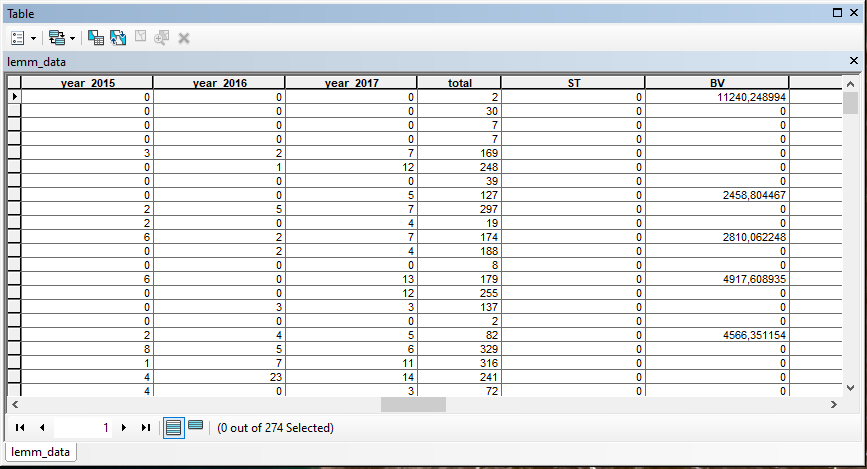
I haven't used ArcMap in while but this does not seem right to me. Does anyone know what the problem is?
Solved! Go to Solution.
Accepted Solutions
- Mark as New
- Bookmark
- Subscribe
- Mute
- Subscribe to RSS Feed
- Permalink
I found a workaround for this problem. I have to correct my previous statement that the numbers seen in the first picture are "not present in my dataset". In fact, they are in a column called "NONE" and causing the issue. By creating a new column "NONE2" and deleting "NONE", the data can be displayed correctly.
This is due to the strange behavior of the "normalization" option in the symbology. The default value is "none" and it will take every field into account with that name (ignoring upper and lower case letters).
In summary, you should avoid to have any fields named "NONE" in your attribute table.
- Mark as New
- Bookmark
- Subscribe
- Mute
- Subscribe to RSS Feed
- Permalink
What's with the 3 comma separated values showing up on the unique values and your table of contents? Your attribute table seems fine as it doesnt have them. What data type is the field?
- Mark as New
- Bookmark
- Subscribe
- Mute
- Subscribe to RSS Feed
- Permalink
I noticed that too but ignored it as unique values worked fine. The field is "Double".
- Mark as New
- Bookmark
- Subscribe
- Mute
- Subscribe to RSS Feed
- Permalink
I've never seen that before. Can you add a new field as float and use field calculator to calculate the same values and retry on that field. What does it look like if you based one of those values from the total column into excel?
- Mark as New
- Bookmark
- Subscribe
- Mute
- Subscribe to RSS Feed
- Permalink
The new float column has the same issues. However, I noticed some <Null> values in my data. This may be a result of joins.
I'm not sure if I got your second question right. Copying the data in Excel makes them formated as "general".
- Mark as New
- Bookmark
- Subscribe
- Mute
- Subscribe to RSS Feed
- Permalink
I think the joins or relates are messing things up. Right click on your feature in the table of contents and go to data->export and create a new feature.
- Mark as New
- Bookmark
- Subscribe
- Mute
- Subscribe to RSS Feed
- Permalink
Exporting the feature to a new geodatabase did not solve the problem. Also exporting it to a shapefile made no difference. I fail to understand the issue as the attribute table looks fine. I can try getting rid of the <Null> values by changing them to "0".
- Mark as New
- Bookmark
- Subscribe
- Mute
- Subscribe to RSS Feed
- Permalink
I replaced all <Null> with zeroes, same problem.
- Mark as New
- Bookmark
- Subscribe
- Mute
- Subscribe to RSS Feed
- Permalink
I found a workaround for this problem. I have to correct my previous statement that the numbers seen in the first picture are "not present in my dataset". In fact, they are in a column called "NONE" and causing the issue. By creating a new column "NONE2" and deleting "NONE", the data can be displayed correctly.
This is due to the strange behavior of the "normalization" option in the symbology. The default value is "none" and it will take every field into account with that name (ignoring upper and lower case letters).
In summary, you should avoid to have any fields named "NONE" in your attribute table.