- Home
- :
- All Communities
- :
- Products
- :
- Data Management
- :
- Data Management Questions
- :
- Re: visualizing sea level rise change - need help
- Subscribe to RSS Feed
- Mark Topic as New
- Mark Topic as Read
- Float this Topic for Current User
- Bookmark
- Subscribe
- Mute
- Printer Friendly Page
- Mark as New
- Bookmark
- Subscribe
- Mute
- Subscribe to RSS Feed
- Permalink
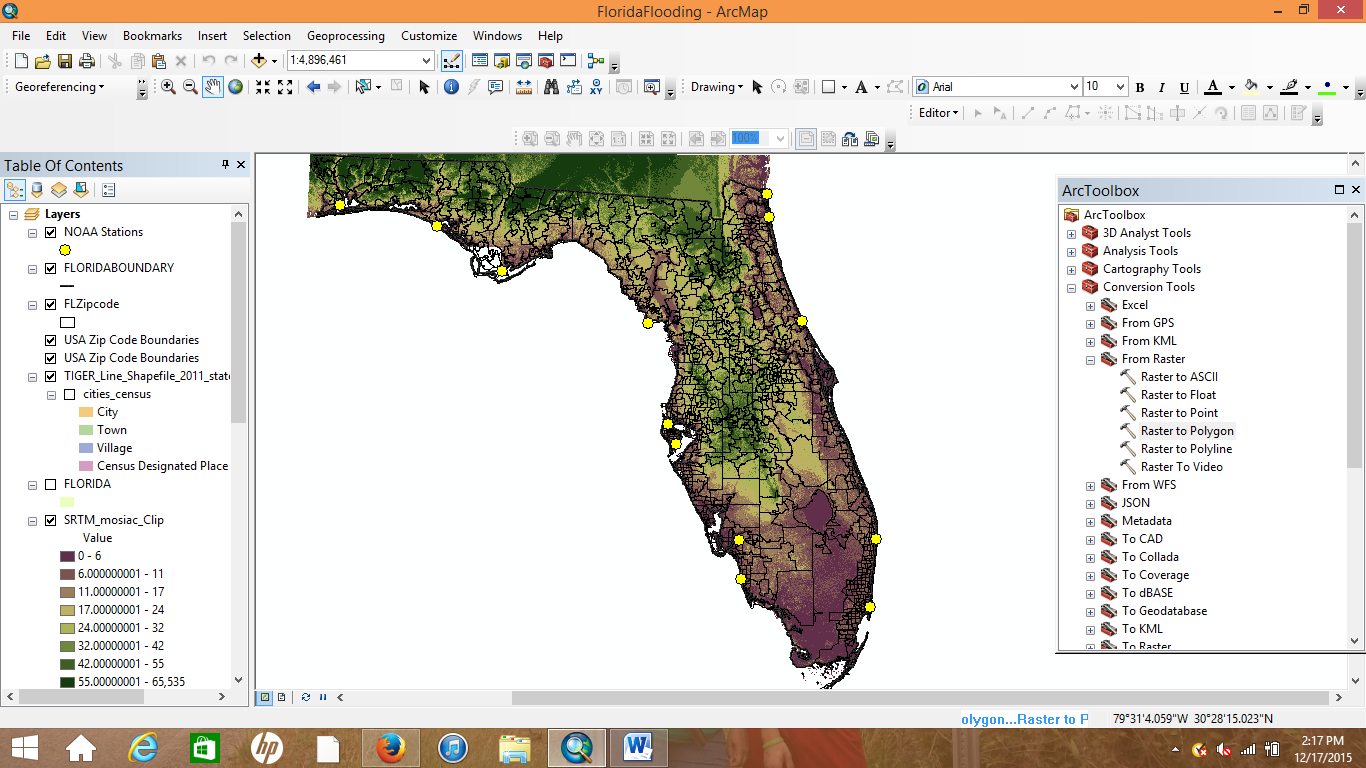
I have been trying dabbling with ArcGIS and I am stuck. I have 15 points in a shapefile with longitude, latitude coordinates, station names, and calculated sea level rise rates for each point using a formula I obtained from NOAA. From the years 2020-2050, I would like to show an average sea level rise change between each station based on the sea level rates I calculated, as well as the area that would become inundated. I have tried interpolation and krieging but it did not work. I was hoping someone could push me in the right direction. Below I have attached pictures of what I am doing.
Thanks,
Chase
Solved! Go to Solution.
Accepted Solutions
- Mark as New
- Bookmark
- Subscribe
- Mute
- Subscribe to RSS Feed
- Permalink
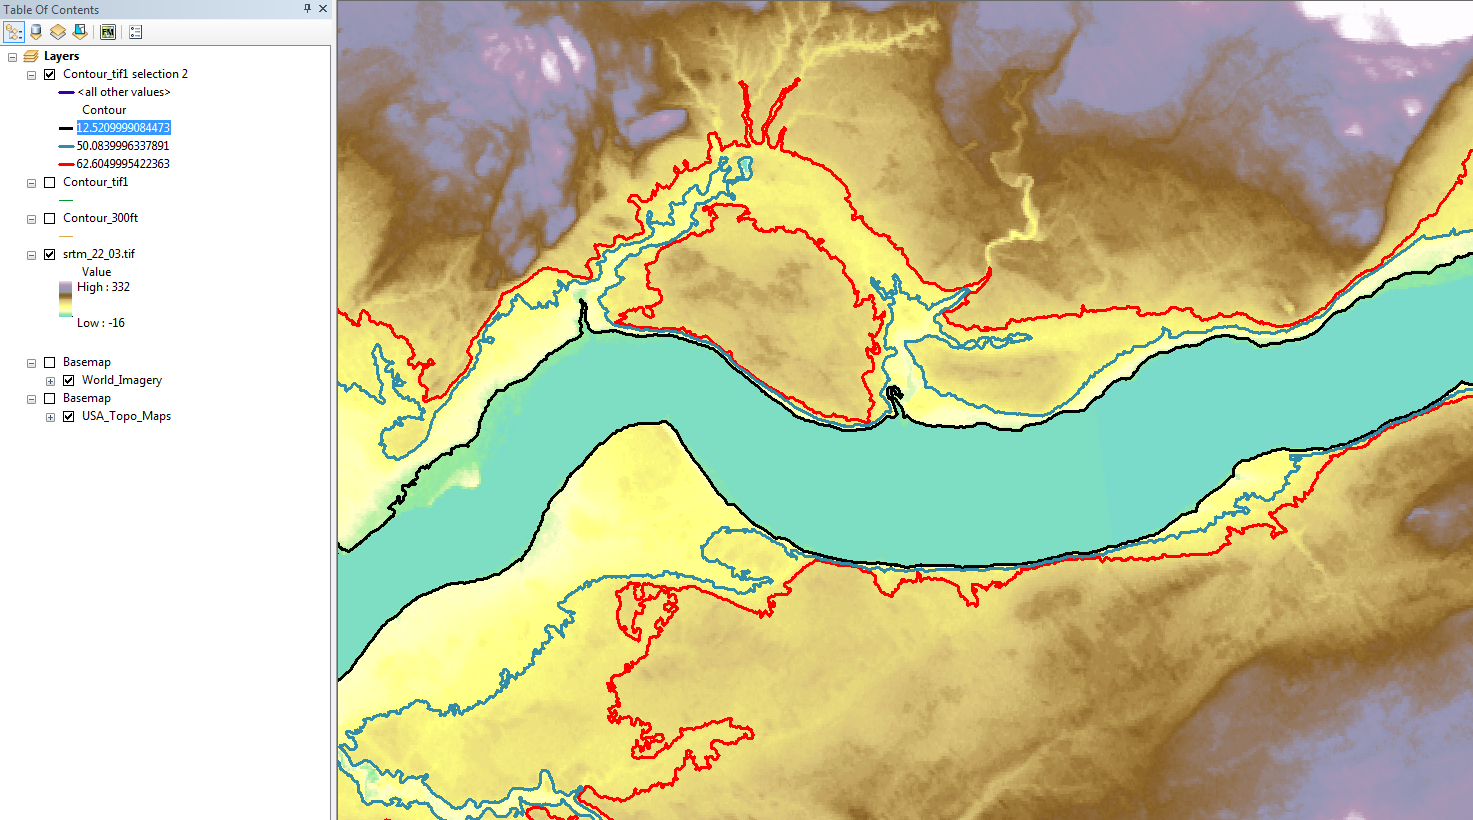
Maybe I'm misunderstanding the type of data you are working with. You can use the contour tool with the SRTM dem data and close the polyline contours generated to create polygons for inundated area, but the different contour lines would have the same effect to show rise in sea level. Below is an example of generating different contour intervals from a SRTM dem downloaded from CGIARCIS.
- Mark as New
- Bookmark
- Subscribe
- Mute
- Subscribe to RSS Feed
- Permalink
I would think you would need to start with a current mean sea-level elevation. Then use the contour tool to generate a contour line of the mean sea level rise + SLR_2020 or whatever elevation rise you are looking at. Just be careful that all your elevation units are the same.
- Mark as New
- Bookmark
- Subscribe
- Mute
- Subscribe to RSS Feed
- Permalink
I understand what you are saying. However, the elevation data I obtained is SRTM data which is raster data. I would need vector data in order to do the contour thing though.
- Mark as New
- Bookmark
- Subscribe
- Mute
- Subscribe to RSS Feed
- Permalink
if it is raster, use the spatial analyst extension to query for elevations below the sea level rise threshold. This can be accomplished in a variety of ways, for example the Con—Help | ArcGIS for Desktop
- Con("DEM", "DEM", 0, "value < 2")
to show the changes in the shoreline for a 2m elevation rise
- Mark as New
- Bookmark
- Subscribe
- Mute
- Subscribe to RSS Feed
- Permalink
Maybe I'm misunderstanding the type of data you are working with. You can use the contour tool with the SRTM dem data and close the polyline contours generated to create polygons for inundated area, but the different contour lines would have the same effect to show rise in sea level. Below is an example of generating different contour intervals from a SRTM dem downloaded from CGIARCIS.