- Home
- :
- All Communities
- :
- Products
- :
- Data Management
- :
- Data Management Questions
- :
- Re: Graphing vertical lines
- Subscribe to RSS Feed
- Mark Topic as New
- Mark Topic as Read
- Float this Topic for Current User
- Bookmark
- Subscribe
- Mute
- Printer Friendly Page
Graphing vertical lines
- Mark as New
- Bookmark
- Subscribe
- Mute
- Subscribe to RSS Feed
- Permalink
I'm creating a vertical line graph of data that was collected at various station points along a pipeline. In some of the areas, there are null values for the data at a particular station or multiple stations. I would like the vertical line to stop at the null points, and continue again when there is data. (like a dashed line) Currently, the null valued data is being ignored, and a line is being drawn from the last point with data to the next point with data. I have looked all through the advanced properties of the graph, and can't find anything that will do what I need. I don't what to have to create multiple series within the graph to create this broken line.
Does anyone know how to accomplish what I need? I've attached a picture of what I need it to look like.
thanks in advance!

- Mark as New
- Bookmark
- Subscribe
- Mute
- Subscribe to RSS Feed
- Permalink
You have to treat each break in the dataset as a new pair of data. So split your data where a null value occurs and treat it as a pair. Implementing this depends on the format of the data of course
- Mark as New
- Bookmark
- Subscribe
- Mute
- Subscribe to RSS Feed
- Permalink
Thanks. That's exactly what I was hoping I didn't have to do. I just can't believe that when you create a graph, it doesn't recognize null values in data.
- Mark as New
- Bookmark
- Subscribe
- Mute
- Subscribe to RSS Feed
- Permalink
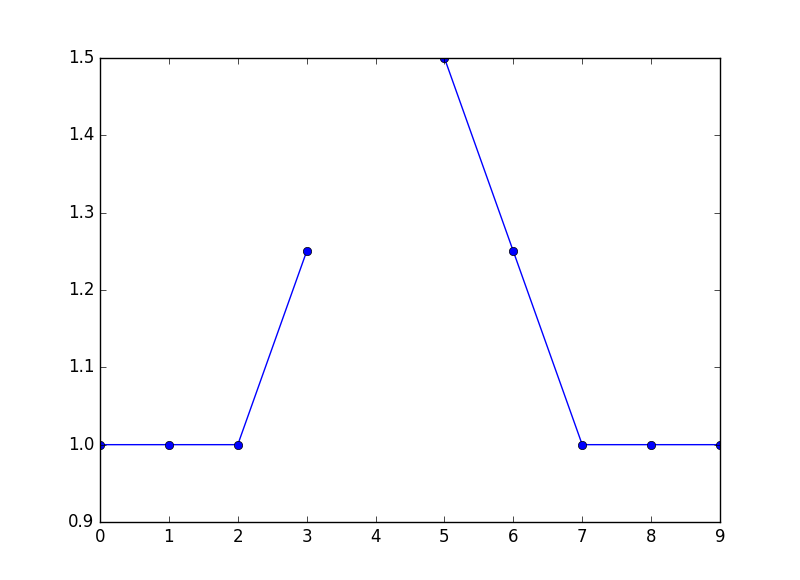
of course you don't have to stick with arcmap, since matplotlib is builtin.
import matplotlib.pyplot as plt
x = np.arange(10)
y = [ 1, 1, 1, 1.25, None, 1.5, 1.25, 1, 1, 1]
plt.plot(x, y, linestyle='-', marker='o')
[<matplotlib.lines.Line2D at 0x17de70d9ac8>]
plt.show()
yields