- Home
- :
- All Communities
- :
- Products
- :
- ArcGIS StoryMaps
- :
- Classic Esri Story Maps Questions
- :
- Re: Adding Image to AGO Story Map Swiper
- Subscribe to RSS Feed
- Mark Topic as New
- Mark Topic as Read
- Float this Topic for Current User
- Bookmark
- Subscribe
- Mute
- Printer Friendly Page
- Mark as New
- Bookmark
- Subscribe
- Mute
- Subscribe to RSS Feed
- Permalink
I'm in the process of building a Story Map Swiper and i'm trying to find a way to include a few graphs in the map but cant seem to figure out how. I'm not using a series, its only 1 location included in the swiper. By looking in the gallery section i can see that others have included images in the description section of the map but i cant figure out how to do this.
Here is an example of Swiper map with images in the description section
Any help would be appreciated.
Thanks,
Benjamin MIttler
Solved! Go to Solution.
Accepted Solutions
- Mark as New
- Bookmark
- Subscribe
- Mute
- Subscribe to RSS Feed
- Permalink
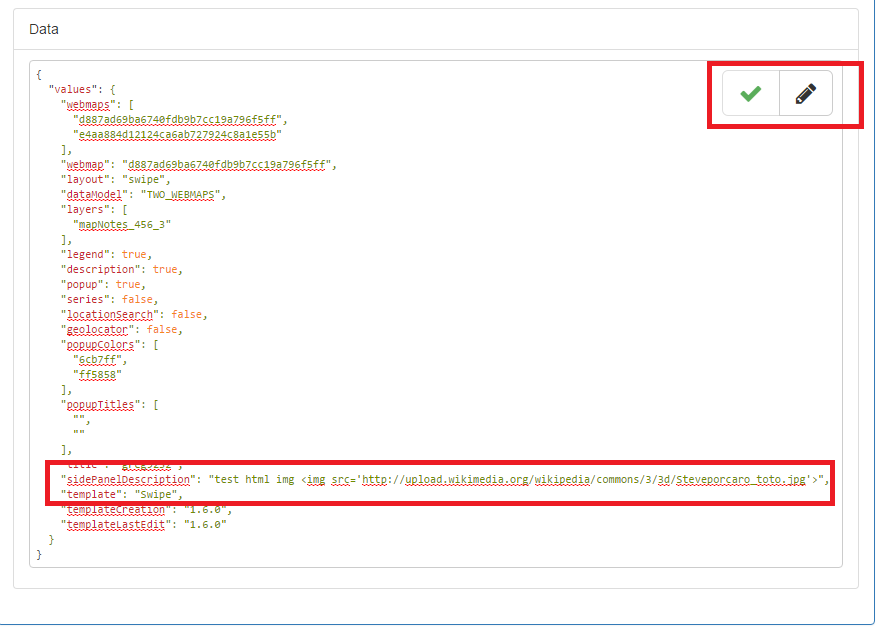
There is no way to include image in the description using the builder easily unfortunately but you can use the following tool https://ago-assistant.esri.com/ to manually edit the application data. After the selection the application and clicking "I want to" > "View an item's JSON", scroll down until you find the description and insert your image using the img HTML tag. Then save using the tool in the corner.
Be very careful that tool can easily break your application 
- Mark as New
- Bookmark
- Subscribe
- Mute
- Subscribe to RSS Feed
- Permalink
There is no way to include image in the description using the builder easily unfortunately but you can use the following tool https://ago-assistant.esri.com/ to manually edit the application data. After the selection the application and clicking "I want to" > "View an item's JSON", scroll down until you find the description and insert your image using the img HTML tag. Then save using the tool in the corner.
Be very careful that tool can easily break your application
- Mark as New
- Bookmark
- Subscribe
- Mute
- Subscribe to RSS Feed
- Permalink
Well, that's a bummer. Any alternative solutions on how to included a graph on a Story Map Swiper? (i dont wanna mess with the code if i don't have to) The goal of this swiper project is to swipe between two imageries, one a the beginning of a drought and one at its peak. The graphs accompanying it show that pollutant levels increase as water level decreases due to drought.
Right now the only alternative i can think of is including a dummy shapefile with two points next to my waterbody, and customizing the symbology for those points to be a white box with TP inside (Total Phosphorus), and a white box with TN inside (Total Nitrogen). Ideally one would be able to click theses boxs and the graph would be in the pop-up.
This solutions seems a bit unintuitive to a user, and im not 100% sure i can customize symbology yet =(