- Home
- :
- All Communities
- :
- Products
- :
- ArcGIS Web AppBuilder
- :
- ArcGIS Web AppBuilder Questions
- :
- Re: why does Infographic not show all results?
- Subscribe to RSS Feed
- Mark Topic as New
- Mark Topic as Read
- Float this Topic for Current User
- Bookmark
- Subscribe
- Mute
- Printer Friendly Page
why does Infographic not show all results?
- Mark as New
- Bookmark
- Subscribe
- Mute
- Subscribe to RSS Feed
- Permalink
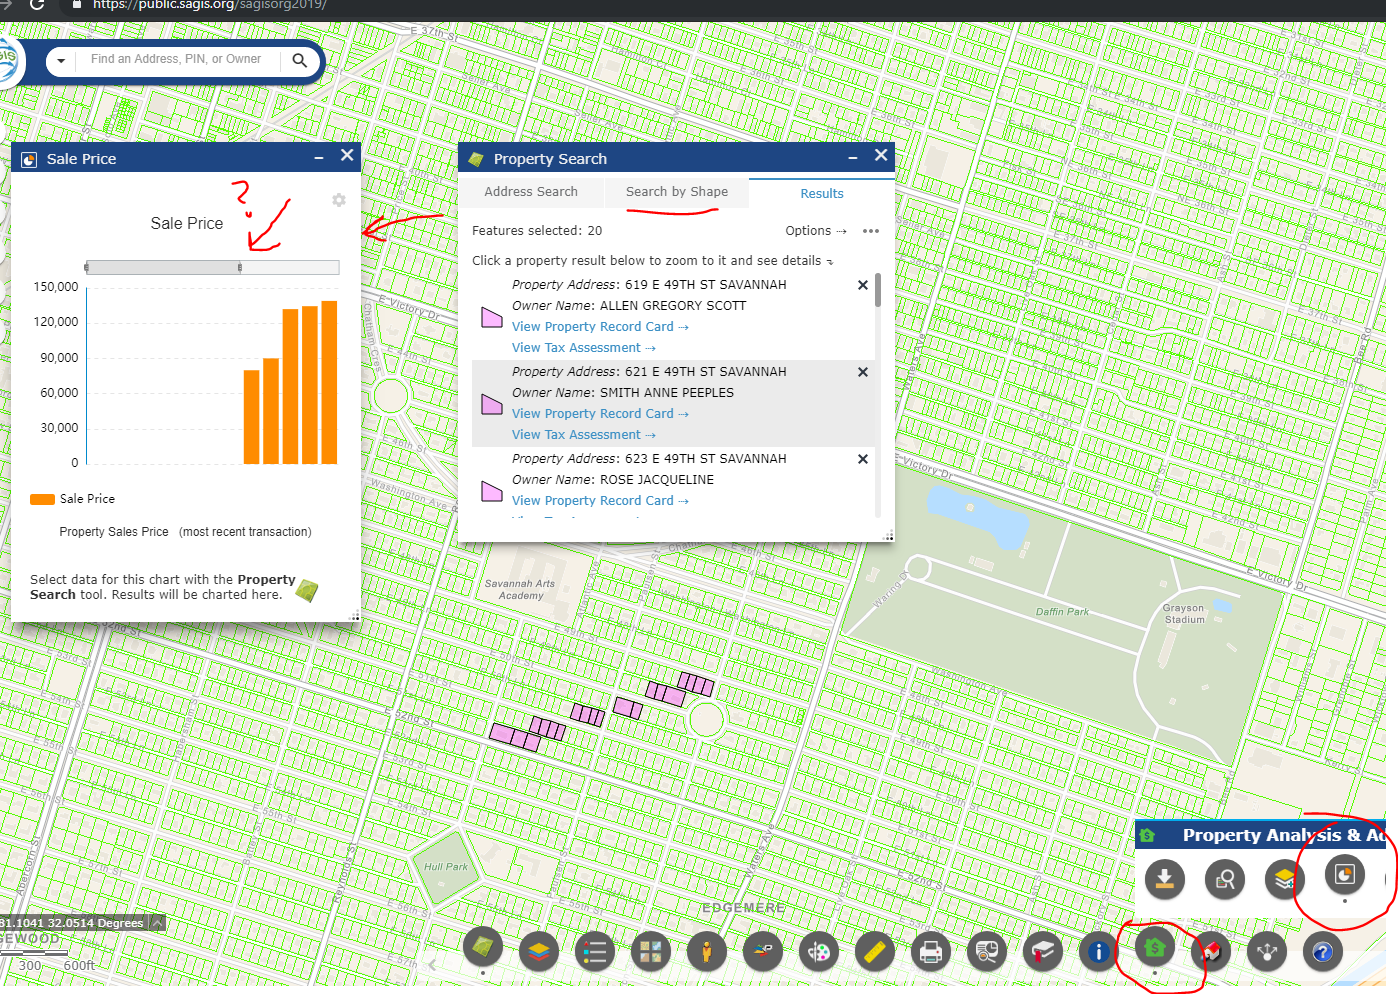
Why does Infographic not show all results (by default)? I am using the current WAB 2.12. I feed Robert's eSearch result to some Inofgraphic chart widgets to show things like Sale Price and Value for selected parcels.
By default it seems to have the sliders only show some of the columns. This will confuse users, I will have to create a text span note to tell them to expand them. https://public.sagis.org/sagisorg2019/
Is this a bug? Support said they did not know why it would do this.
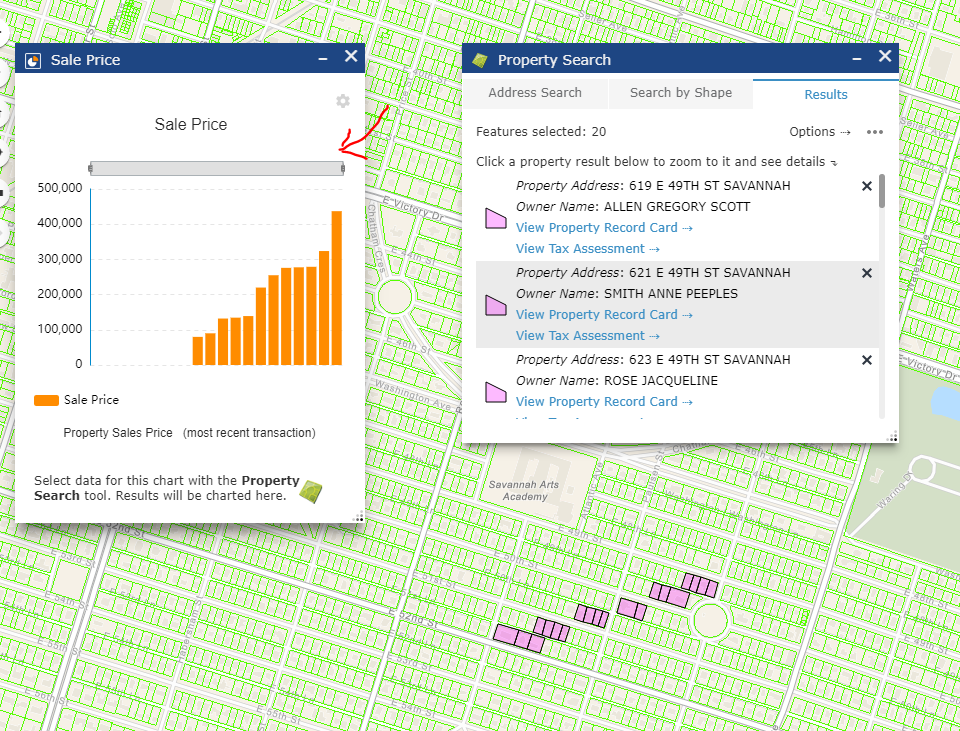
After expanding the sliders...
- Mark as New
- Bookmark
- Subscribe
- Mute
- Subscribe to RSS Feed
- Permalink
Bug is still in WAB 2.13.
- Mark as New
- Bookmark
- Subscribe
- Mute
- Subscribe to RSS Feed
- Permalink
Kevin, the horizontal bar on the top is to slide through the graphic columns showing in the chart. For example, when the returned properties are more than 100, it would be difficult to see all the graphics condensed together without the slide bar. I think in this case though, you may remove the properties with sale value to zero (the blank area in the chart), making room for non-zero properties by sorting by the sale price option in the widget. Does it make sense?
- Mark as New
- Bookmark
- Subscribe
- Mute
- Subscribe to RSS Feed
- Permalink
Good morning Jianxia Song! - Yes indeed, I would in fact love to remove properties of value "0". That was another question I have had... Both for this, and for Situational Awareness... Is there a way to filter null/0 values out from either of these widgets? (If not, I propose this as a Feature Enhancement for an update) Reason I ask, is I use Situational Awareness to show Average, Total, Min etc of Property Value and Sale Price. Zero values, we have many, especially government property transfers, so it messes up the average.
Regarding Infographic - I understand the purpose of the Slider. However, what we would like is to make them set to completely 100% expanded, by default. Most users for this site (and probably many users for many Infographic user stories) want it fully expanded as they will probably only selected 10 to 50 or so records. After about 10 it collapses. It is very useful to see all bars if it is 40 or so even. But users may not realize to expand the slider.
Is there an event or method I can use in the widget.js to make it expand by default, always?
(This would also be a good Feature Enhancement to add this as a Config option)
Thank you Jianxia and the WAB team as always! We love WAB and I thank you for your time.
- Mark as New
- Bookmark
- Subscribe
- Mute
- Subscribe to RSS Feed
- Permalink
Kevin, an option to expand the slider bar to 100 by default has been logged. As far as zero value is concerned, the Infographic widget has an option to ignore the null value for average and other calculations. Could you replace zero with null in data?
- Mark as New
- Bookmark
- Subscribe
- Mute
- Subscribe to RSS Feed
- Permalink
Jianxia Song thank you so much! For rapid logging for enhancement.
As to 0 value, no. This would be another Enhancement I think. Here is the reason why. And it is common to literally every county and city in the world or at least this area. A zero value for sale price means certain things, like if it is government property or was gifted. That is different than null. That would be a workaround if in fact we had no nulls which we shouldn't but I don't want to change the official parcel data and it could also have other cascading ramifications. Thus, ability to ignore 0 would be useful. Thank you again!! If they implement the Slider fix, I will be happy to beta test the widget or block of workaround code so I can get a preview as soon as possible.
- Mark as New
- Bookmark
- Subscribe
- Mute
- Subscribe to RSS Feed
- Permalink
Kevin, thanks for explaining the zero value. It makes sense to me now. To programmatically expand the slider bar by default, you may replace /client/stemapp/jimu.js/dijit/_chartUtils.js #L632 with zoomOption.end = 100.
- Mark as New
- Bookmark
- Subscribe
- Mute
- Subscribe to RSS Feed
- Permalink
Jianxia Song this works perfectly and I just implemented it, thank you. 