Turn on suggestions
Auto-suggest helps you quickly narrow down your search results by suggesting possible matches as you type.
Cancel
- Home
- :
- All Communities
- :
- Products
- :
- ArcGIS Web AppBuilder
- :
- ArcGIS Web AppBuilder Questions
- :
- Infographic Widget - Use Layer’s Symbology Issue
Options
- Subscribe to RSS Feed
- Mark Topic as New
- Mark Topic as Read
- Float this Topic for Current User
- Bookmark
- Subscribe
- Mute
- Printer Friendly Page
Infographic Widget - Use Layer’s Symbology Issue
Subscribe
1173
1
09-24-2017 09:11 PM
09-24-2017
09:11 PM
- Mark as New
- Bookmark
- Subscribe
- Mute
- Subscribe to RSS Feed
- Permalink
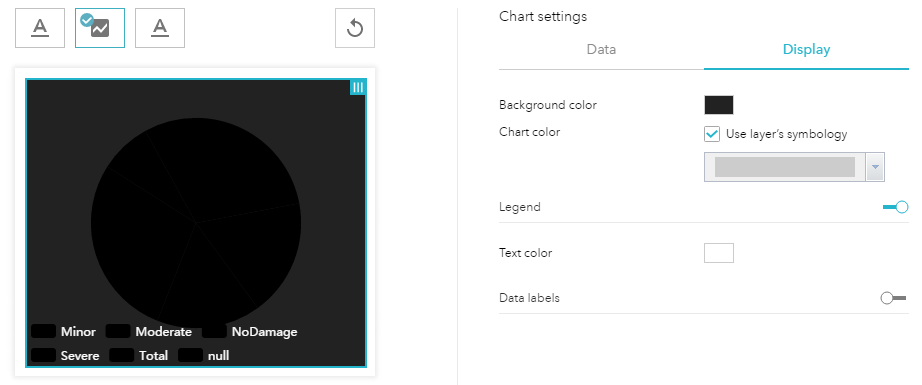
Using the September update to Web App Builder you can use the layer symbology to appropriately colour the bars of your chart or pieces of your pie.
Unfortunately it's not working for me.
I have a registered services from ArcGIS Server 10.4.1 on AGOL and am using that in a map.
When I use the option I get black pie sections.
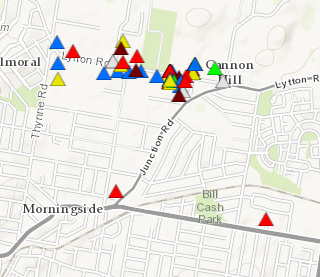
The layer is simple triangles with coloured interiors in ArcMap.
A limitation of non-hosted services?
1 Reply
09-27-2017
10:25 PM
- Mark as New
- Bookmark
- Subscribe
- Mute
- Subscribe to RSS Feed
- Permalink
Thanks for the info 