- Home
- :
- All Communities
- :
- Products
- :
- ArcGIS Web AppBuilder
- :
- ArcGIS Web AppBuilder Questions
- :
- Re: How to query multiple layers by user-selected ...
- Subscribe to RSS Feed
- Mark Topic as New
- Mark Topic as Read
- Float this Topic for Current User
- Bookmark
- Subscribe
- Mute
- Printer Friendly Page
How to query multiple layers by user-selected boundary in dashboard theme?
- Mark as New
- Bookmark
- Subscribe
- Mute
- Subscribe to RSS Feed
- Permalink
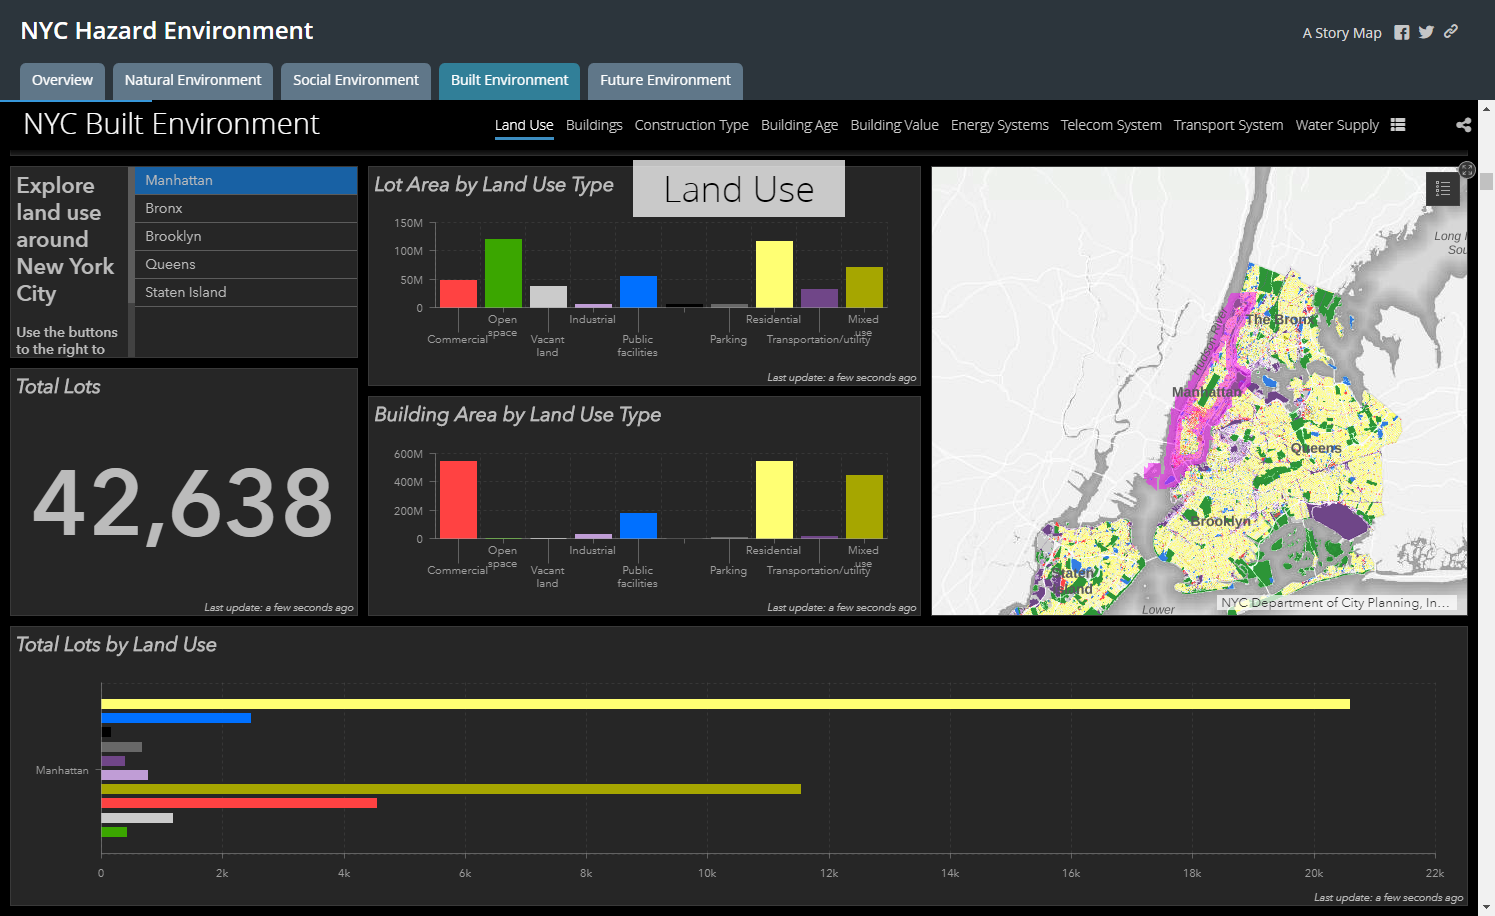
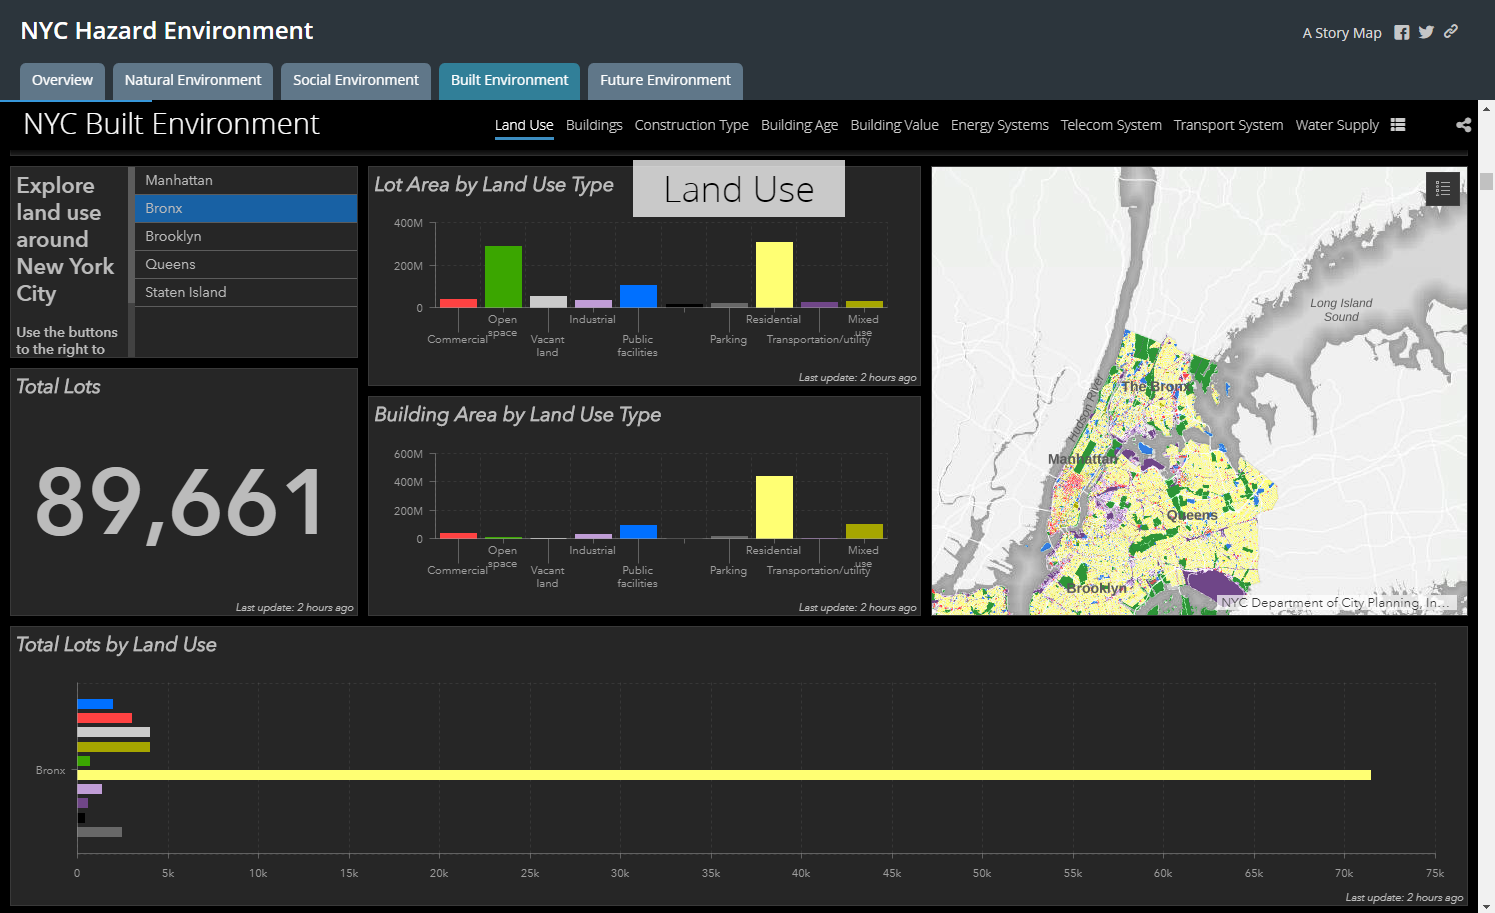
I have seen this example within NYC Hazard Environment Story Map, and it is exactly what I want to do but I don't know how(see screenshots below): User can select a region and everything in the dashboard change accordingly, both map and infographics.
Q1. Is this NYC dashboard built on a single land use layer or land use plus a borough boundary layer?
Q2. I have more layers on my map (points and lines) that I want to query by a boundary layer, is it feasible?
Q3. What widget should I use to realize this function? I tried Filter, Group Filter, and Query, none works for me. They can only query within one layer, whereas I want the boundary layer to grab everything within from other layers, show them on the dashboard, and switch when user change selection.
Thank you very much!
- Silvia
- Mark as New
- Bookmark
- Subscribe
- Mute
- Subscribe to RSS Feed
- Permalink
Under the current Query Widget, I'll have to query twice which will create two new layers. First, query out one boundary shape (as a result layer) from my boundary layer, then add another query just to return features within that result boundary layer.
I need these functions in one widget, with one click of the target boundary name, and everything in the dashboard changes accordingly.