- Home
- :
- All Communities
- :
- Products
- :
- ArcGIS Web AppBuilder
- :
- ArcGIS Web AppBuilder Questions
- :
- Re: further customization to Buffer tool
- Subscribe to RSS Feed
- Mark Topic as New
- Mark Topic as Read
- Float this Topic for Current User
- Bookmark
- Subscribe
- Mute
- Printer Friendly Page
- Mark as New
- Bookmark
- Subscribe
- Mute
- Subscribe to RSS Feed
- Permalink
Hello, all. a while back i downloaded a buffer tool that fit our purpose fairly well but now with my limited WAB experience i am stuck. it was made i believe by Mr. Scheitlin and called cotBuffer (cot = City of Tulsa?). the tool allows you to enter distances and then you click on the map and it will create buffers from your clicked point at the distances specified. Only i noticed the measurements are off and in reading about it, I need help in adding geodesic properties to the measurements like the Draw and Measure tool have. where to add that in the cotBuffer code? also if someone could help in making the buffers in 3 different colors, as they have to denote Hot Zone, Warm Zone, and Cold Zone. any help would be greatly appreciated.
Solved! Go to Solution.
Accepted Solutions
- Mark as New
- Bookmark
- Subscribe
- Mute
- Subscribe to RSS Feed
- Permalink
Rocio,
Here are the changes then:
createCOTBuffers: function(evtObj) {
this.drawBox.deactivate();
var geometry = evtObj.geometry,
symbol;
symbol = new SimpleMarkerSymbol(SimpleMarkerSymbol.STYLE_SQUARE, 10, new SimpleLineSymbol(SimpleLineSymbol.STYLE_SOLID, new Color([255, 0, 0]), 1), new Color([0, 255, 0, 0.25]));
var graphic = new Graphic(geometry, symbol);
this.map.graphics.add(graphic);
this.drawBox.clear();
//setup the buffer parameters
var params = new BufferParameters();
//Reversed the order of distance so that buffers are added in proper stacked order
params.distances = [ this.thirdDistance.value, this.secondDistance.value, this.firstDistance.value];
params.outSpatialReference = this.map.spatialReference;
params.unit = GeometryService[this.unit.value];
//Added 11/20/17
params.geodesic = true;
//End add
//normalize the geometry
normalizeUtils.normalizeCentralMeridian([geometry]).then(lang.hitch(this, function(normalizedGeometries) {
var normalizedGeometry = normalizedGeometries[0];
params.geometries = [normalizedGeometry];
esriConfig.defaults.geometryService.buffer(params, lang.hitch(this, this.showCOTBuffers));
}));
},
showCOTBuffers: function(bufferedGeometries) {
//Added more symbols to get the three colors
var symbols = [];
var symbol = new SimpleFillSymbol(
SimpleFillSymbol.STYLE_SOLID,
new SimpleLineSymbol(
SimpleLineSymbol.STYLE_SOLID,
new Color([255, 0, 0, 0.65]), 2
),
new Color([255, 0, 0, 0.35])
);
var symbol2 = new SimpleFillSymbol(
SimpleFillSymbol.STYLE_SOLID,
new SimpleLineSymbol(
SimpleLineSymbol.STYLE_SOLID,
new Color([242, 101, 34, 0.65]), 2
),
new Color([242, 101, 34, 0.35])
);
var symbol3 = new SimpleFillSymbol(
SimpleFillSymbol.STYLE_SOLID,
new SimpleLineSymbol(
SimpleLineSymbol.STYLE_SOLID,
new Color([0, 0, 255, 0.65]), 2
),
new Color([0, 0, 255, 0.35])
);
var symbols = [symbol3, symbol2, symbol];
array.forEach(bufferedGeometries, lang.hitch(this, function(geometry, index) {
var graphic = new Graphic(geometry, symbols[index]);
this.map.graphics.add(graphic);
}));
}- Mark as New
- Bookmark
- Subscribe
- Mute
- Subscribe to RSS Feed
- Permalink
Rocio,
I don't remember that one, but as much as I do it is probable that I did and just don't remember. Can you provide the thread link or the widgets source?
- Mark as New
- Bookmark
- Subscribe
- Mute
- Subscribe to RSS Feed
- Permalink
Good morning and thank you for your prompt reply, Mr. Scheitlin. This is the thread containing the cotBuffer download link:
- Mark as New
- Bookmark
- Subscribe
- Mute
- Subscribe to RSS Feed
- Permalink
Rocio,
Here are the changes then:
createCOTBuffers: function(evtObj) {
this.drawBox.deactivate();
var geometry = evtObj.geometry,
symbol;
symbol = new SimpleMarkerSymbol(SimpleMarkerSymbol.STYLE_SQUARE, 10, new SimpleLineSymbol(SimpleLineSymbol.STYLE_SOLID, new Color([255, 0, 0]), 1), new Color([0, 255, 0, 0.25]));
var graphic = new Graphic(geometry, symbol);
this.map.graphics.add(graphic);
this.drawBox.clear();
//setup the buffer parameters
var params = new BufferParameters();
//Reversed the order of distance so that buffers are added in proper stacked order
params.distances = [ this.thirdDistance.value, this.secondDistance.value, this.firstDistance.value];
params.outSpatialReference = this.map.spatialReference;
params.unit = GeometryService[this.unit.value];
//Added 11/20/17
params.geodesic = true;
//End add
//normalize the geometry
normalizeUtils.normalizeCentralMeridian([geometry]).then(lang.hitch(this, function(normalizedGeometries) {
var normalizedGeometry = normalizedGeometries[0];
params.geometries = [normalizedGeometry];
esriConfig.defaults.geometryService.buffer(params, lang.hitch(this, this.showCOTBuffers));
}));
},
showCOTBuffers: function(bufferedGeometries) {
//Added more symbols to get the three colors
var symbols = [];
var symbol = new SimpleFillSymbol(
SimpleFillSymbol.STYLE_SOLID,
new SimpleLineSymbol(
SimpleLineSymbol.STYLE_SOLID,
new Color([255, 0, 0, 0.65]), 2
),
new Color([255, 0, 0, 0.35])
);
var symbol2 = new SimpleFillSymbol(
SimpleFillSymbol.STYLE_SOLID,
new SimpleLineSymbol(
SimpleLineSymbol.STYLE_SOLID,
new Color([242, 101, 34, 0.65]), 2
),
new Color([242, 101, 34, 0.35])
);
var symbol3 = new SimpleFillSymbol(
SimpleFillSymbol.STYLE_SOLID,
new SimpleLineSymbol(
SimpleLineSymbol.STYLE_SOLID,
new Color([0, 0, 255, 0.65]), 2
),
new Color([0, 0, 255, 0.35])
);
var symbols = [symbol3, symbol2, symbol];
array.forEach(bufferedGeometries, lang.hitch(this, function(geometry, index) {
var graphic = new Graphic(geometry, symbols[index]);
this.map.graphics.add(graphic);
}));
}- Mark as New
- Bookmark
- Subscribe
- Mute
- Subscribe to RSS Feed
- Permalink
Mr. Scheitlin, thank you so much. this worked perfectly.
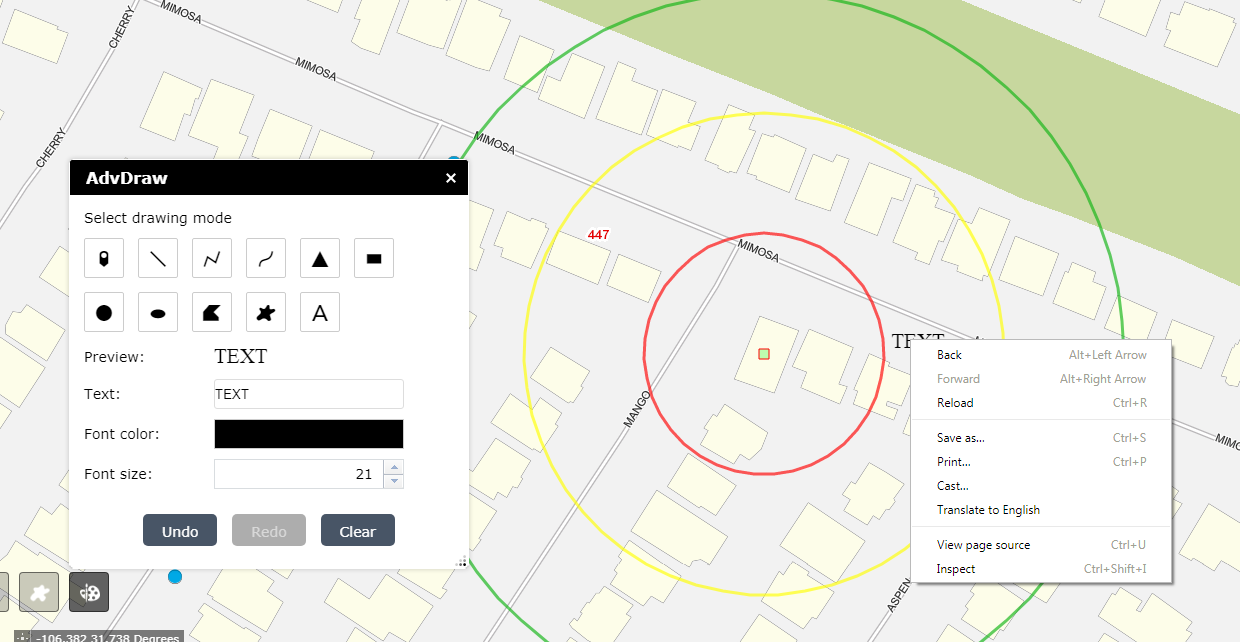
Now the problem i am having is after drawing the buffer, when our users add TEXT to the map with the AdvDraw tool, any text on the buffer is not editable (please see attached screenshots). when we right-click on the text, we dont get the edit options. (NOTE: i made the buffer rings hollow hoping this would make the TEXT editable, but no luck)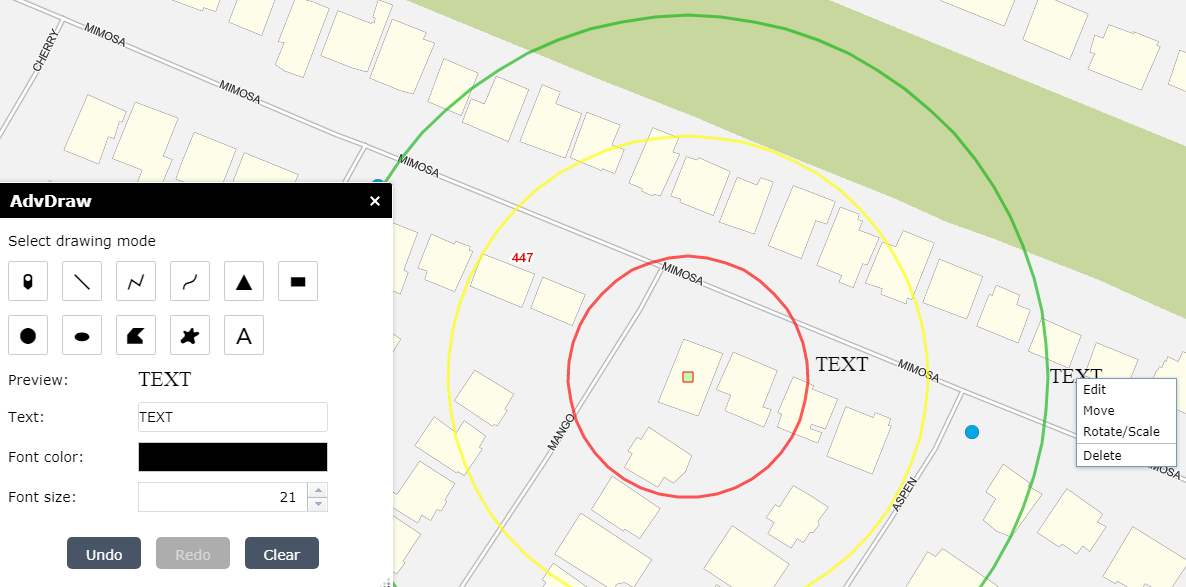
- Mark as New
- Bookmark
- Subscribe
- Mute
- Subscribe to RSS Feed
- Permalink
Hmm. Not sure about that.