Turn on suggestions
Auto-suggest helps you quickly narrow down your search results by suggesting possible matches as you type.
Cancel
- Home
- :
- All Communities
- :
- Products
- :
- ArcGIS Web AppBuilder
- :
- ArcGIS Web AppBuilder Questions
- :
- Re: Charting widget - white text label color over ...
Options
- Subscribe to RSS Feed
- Mark Topic as New
- Mark Topic as Read
- Float this Topic for Current User
- Bookmark
- Subscribe
- Mute
- Printer Friendly Page
Charting widget - white text label color over background: how to change?
Subscribe
692
1
08-29-2019 12:02 PM
by
Anonymous User
Not applicable
08-29-2019
12:02 PM
- Mark as New
- Bookmark
- Subscribe
- Mute
- Subscribe to RSS Feed
- Permalink
The Charting widget has a white text label color over the background, making it hard to see a bar's address and value (in my example SAGIS Property Map Viewer -> Charts are in Advanced Tools ) when you hover over an individual bar. Can this be changed and where? And I would recommend for Esri to add this as a user-changeable parameter in the Chart Widget's Config GUI. Jianxia Song
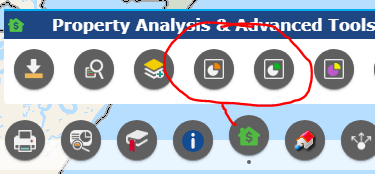

the white text is circled in Red. Kind of hard to see to even demonstrate this point, but... you can see why it is an issue...
1 Reply
08-29-2019
12:27 PM
- Mark as New
- Bookmark
- Subscribe
- Mute
- Subscribe to RSS Feed
- Permalink
Kevin,
Your css rule mod is causing the issue:
/*Kevin mod to show note about using tool*/
.lm_content div div {
background-color: transparent!important;
}If you remove that rule then the tooltip has a gray background and is legible.