- Home
- :
- All Communities
- :
- Products
- :
- ArcGIS Web AppBuilder
- :
- ArcGIS Web AppBuilder Questions
- :
- Assistance with Custom Widget for Portal App
- Subscribe to RSS Feed
- Mark Topic as New
- Mark Topic as Read
- Float this Topic for Current User
- Bookmark
- Subscribe
- Mute
- Printer Friendly Page
- Mark as New
- Bookmark
- Subscribe
- Mute
- Subscribe to RSS Feed
- Permalink
Hello GeoNet and widget gurus! Let me fully disclose that I'm not a developer nor anything close to it... but I'm trying to accomplish something that I think is fairly straightforward for someone with basic JS and widget development experience and needless to say I'm stuck with the following after adding my best attempt to our Portal dev web app:
Uncaught TypeError: Cannot read property 'name' of undefined
at Object.<anonymous> (Widget.js?wab_dv=2.15:68)
at Object.<anonymous> (init.js:64)
at Object.c [as onwidget-created] (init.js:120)
at Function.m.emit (init.js:126)
at Function.m.emit (init.js:127)
at Object.emit (init.js:119)
at Object.<anonymous> (WidgetManager.js?wab_dv=2.15:132)
at init.js:64
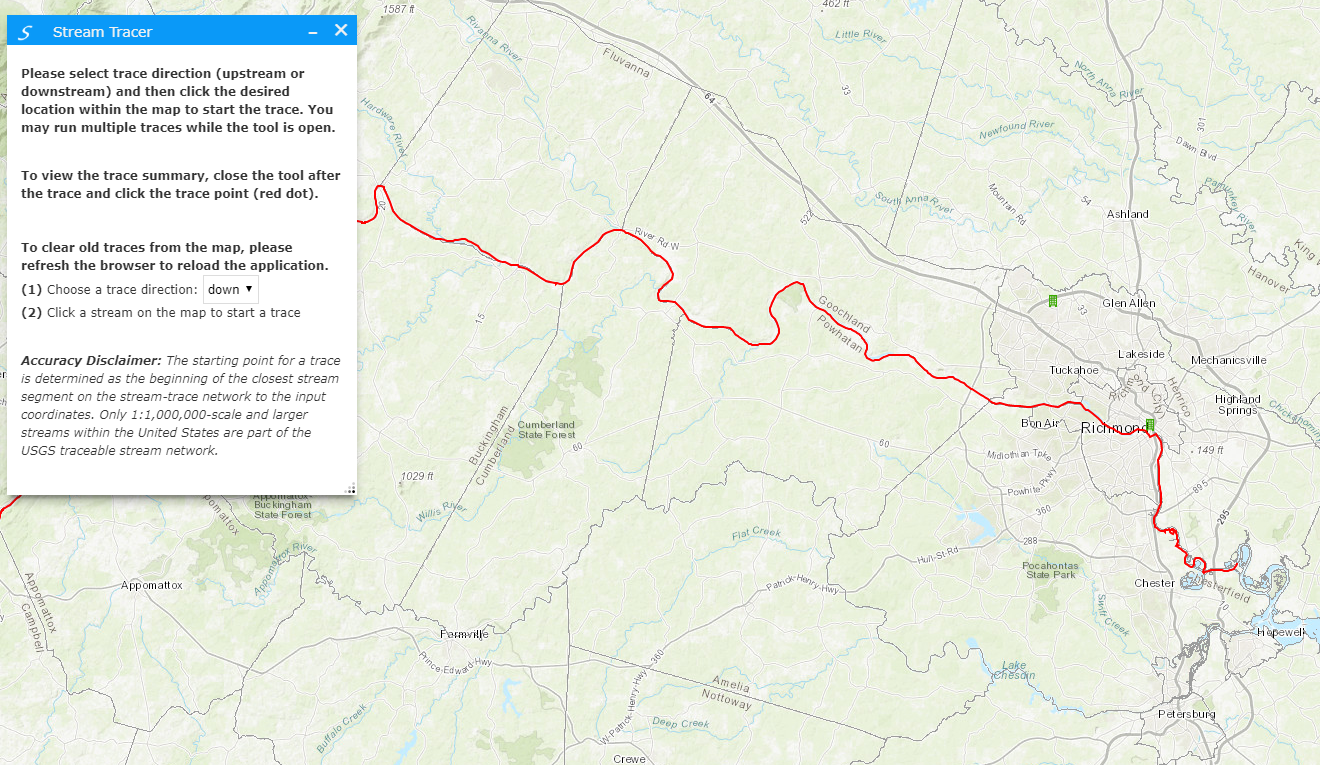
Long story short, we have an internal environmental sciences web application running on Portal that I extend and support here and there using WABD 2.15. I'm trying to build a simple widget, that when opened, prompts a user to select a location / point on the map. Once the click event occurs, I simply want to reach out to the USGS streamer API located here: USGS - Streamer Trace API
Ideally, I'd like to configure my widget.html to simply prompt the user to select the point on the map and select up stream trace or down stream trace, and then for the widget.js file to contain the JS logic to run the operation using their provided code in the link above.
Is there a simple way to transform the USGS example code below to a actionable widget in a WABD app? I've given it a shot but I'm sure there are multiple errors in my widget.js syntax as is currently. Here is the full html that I used as a starting point:
<html>
    <!-- HTML HEAD -->
    <head>
        <meta http-equiv="Content-Type" content="text/html; charset=utf-8">
        <title>Streamer Trace API: Sample #10</title>

        <!-- ESRI JSAPI 3.14 -->
        <link rel="stylesheet" href="https://js.arcgis.com/3.14/esri/css/esri.css">
        <script type="text/javascript" src="https://js.arcgis.com/3.14/"></script>

        <!-- Streamer Trace JSAPI 3.14 -->
        <script type="text/javascript" src="https://txpub.usgs.gov/DSS/Streamer/api/3.14/js/trace_api.min.js"></script>

        <!-- css styling -->
        <style type="text/css">
            html, body, #map {
                height: 100%;
                width: 100%;
                margin: 0px;
                padding: 0px;
                overflow: hidden;
            }
            #HomeButton {
                position: absolute;
                left: 20px;
                top: 90px;
            }
            #description, #controls {
                position: absolute;
                background: rgba(255,255,255,0.8);
                border: 1px solid black;
                border-radius: 5px;
                padding: 10px;
                font-family: Arial, Helvetica, sans-serif;
                z-index: 99;
            }
            #description {
                right: 20px;
                top: 20px;
            }
            #controls {
                left: 70px;
                top: 20px;
            }
        </style>

        <!-- main JavaScript -->
        <script type="text/javascript">
            require( ["esri/map","esri/dijit/HomeButton","dojo/domReady!"], function(Map,HomeButton) {
                // create map
                // since we'll add a trace_api basemap, set the map LevelsOfDetail (zoom levels) to the API basemapLODs
                var map = new Map("map", {
                    "center"          : [-99,38],
                    "zoom"            : 1,
                    "lods"            : trace_api.basemapLODs,
                    "showAttribution" : false,
                    "logo"            : false
                });

                // add "home" navigation button (zooms to initial extent when clicked)
                ( new HomeButton( {"map":map}, "HomeButton") ).startup();

                // connect Trace API "trace-complete" event handler
                trace_api.on( "trace-complete", function() {
                    // give an alert if addTrace failed
                    if ( trace_api.lastAddTraceFailure() ) {
                        // there is a failure message - give alert
                        alert( "trace_api.on 'trace-complete': Trace could not be added to map.\nReason:\n\n" + trace_api.lastAddTraceFailure() + "\n\n" );
                    }
                });

                // add trace_api basemap, USA mask, and set map on-click callback when the trace_api is loaded
                trace_api.on("load", function() {
                    // add the Trace API "imagery" basemap
                    trace_api.addBasemap({
                        "map"     : map,       // map to use
                        "basemap" : "imagery", // ESRI "World Imagery" basemap with Streamer's traceable streams & labels
                        "opacity" : 0.9        // opacity (0-1, 1=100% opaque)
                    });

                    // add gray mask of the United States
                    trace_api.toggleUsaMask({
                        "map"     : map,  // map to use
                        "visible" : true, // toggle visible
                        "opacity" : 0.7   // opacity (0-1, 1=100% opaque)
                    });

                    // set map on-click callback
                    map.on("click", function(evt) {
                        // get trace direction currently selected in drop-down menu
                        var traceDir = document.getElementById("menu_traceDir");
                        traceDir = traceDir.options[traceDir.selectedIndex].text;

                        // add trace using the trace_api.addTrace() method with desired options
                        trace_api.addTrace({
                            "map"            : map,            // map to use
                            // ...parameters defining the stream trace to add...
                            "x"              : evt.mapPoint.x, // set trace origin x-coord to the map click
                            "y"              : evt.mapPoint.y, // set trace origin y-coord to the map click
                            "xy_wkid"        : evt.mapPoint.spatialReference.wkid, // map-click coord spatial reference wkid
                            "traceDir"       : traceDir,       // direction of stream trace (must be "up" or "down")
                            // ...additional trace options...
                            "originPoint"    : "infoHover",    // add point graphic to trace origin with mouse-hover info window
                            "clearOldTraces" : true            // clear any existing map traces before trying to add the new one
                        });
                    }); // end map.on "click"
                }); // end trace_api.on "load"

            }); // end require
        </script>
    </head>

    <!-- HTML BODY -->
    <body>
        <!-- description -->
        <div id="description">
            <b>SAMPLE 10:</b> Adding a trace by clicking the map
        </div>

        <!-- controls -->
        <div id="controls">
            <p>
                <b>(1)</b> Choose a trace direction:
                <select id="menu_traceDir" >
                    <option>down</option>
                    <option>up  </option>
                </select>
            </p>
            <p>
                <b>(2)</b> Click a stream on the map to start a trace
            </p>
        </div>

        <!-- map -->
        <div id="map"></div>

        <!-- home button -->
        <div id="HomeButton"></div>
    </body>

</html>
Thanks for any assistance you can provide! Robert Scheitlin, GISP
Solved! Go to Solution.
Accepted Solutions
- Mark as New
- Bookmark
- Subscribe
- Mute
- Subscribe to RSS Feed
- Permalink
Rex,
It is not that complicated for an experienced developer but could throw a beginner for a loop.
First thing to figure out is how to add the USGS library (i.e. the js file from them). to do that you have to follow the help doc for adding other libraries. Next you have to figure out what goes in the widget.html and the widget.js files. Attached I have the widget working for you to study and use.
- Mark as New
- Bookmark
- Subscribe
- Mute
- Subscribe to RSS Feed
- Permalink
You are a gentleman and a scholar Robert Scheitlin, GISP This is fantastic. Thanks for going the extra mile and providing the completed (and working quite well) widget. I'll play around with the code you have provided and see if I can incorportate some of USGS's other sample extensions like reporting, summaries, etc into the trace results. Thanks again!
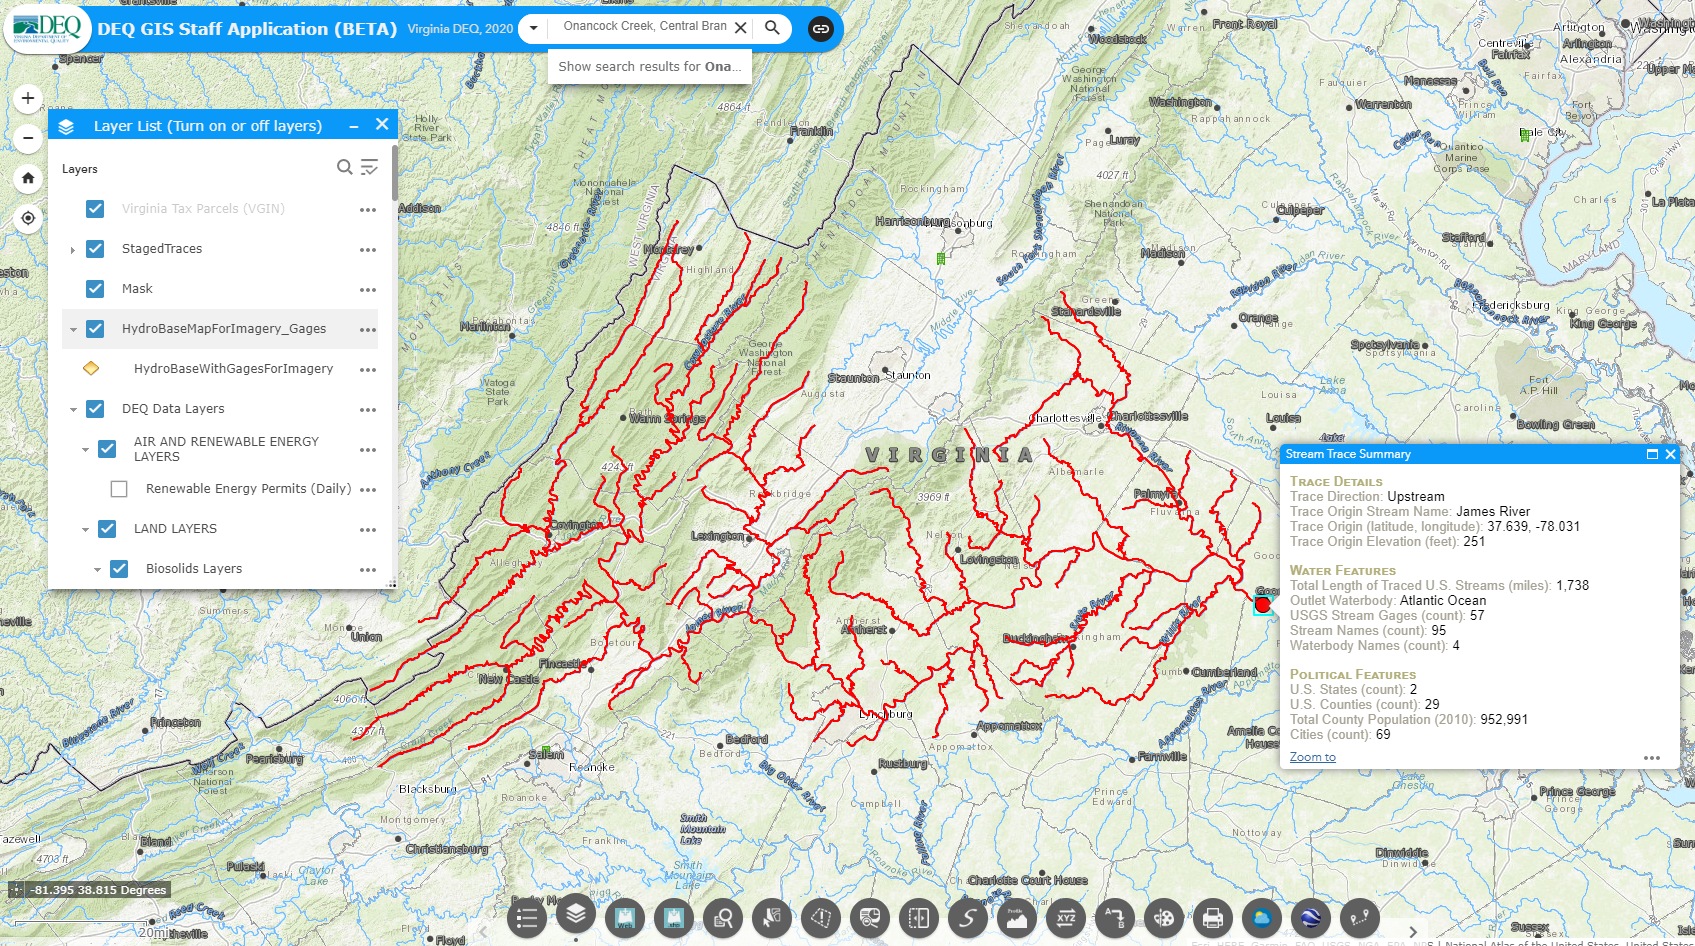
Edit: Adding a tweaked version of the widget that Robert provided in case anyone is interested in this functionality using the USGS Streamer API. There's still a few things I'm woking on such as getting the trace segments merged in the layer widget so that they can be used as a single layer for buffering, and additional analysis, as well as a option to clear previous traces in the widget itself, however for the most part it is functional! Thanks again for all of the help on this!