- Home
- :
- All Communities
- :
- Products
- :
- ArcGIS Web AppBuilder
- :
- ArcGIS Web AppBuilder Questions
- :
- ArcGIS Online Web App Attribute table problems
- Subscribe to RSS Feed
- Mark Topic as New
- Mark Topic as Read
- Float this Topic for Current User
- Bookmark
- Subscribe
- Mute
- Printer Friendly Page
ArcGIS Online Web App Attribute table problems
- Mark as New
- Bookmark
- Subscribe
- Mute
- Subscribe to RSS Feed
- Permalink
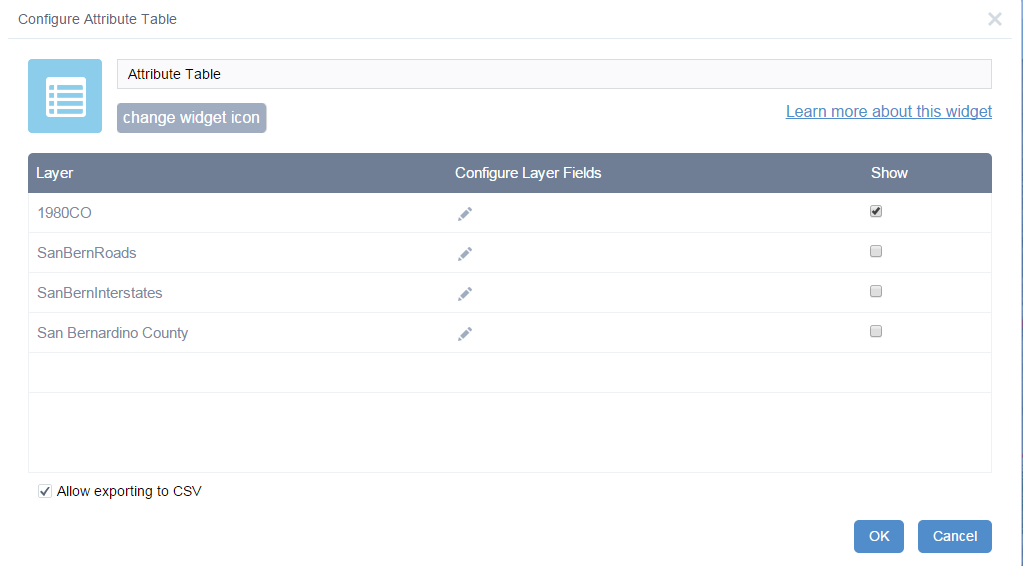
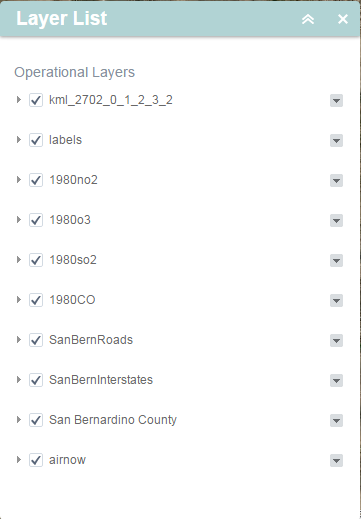
I am still working with the EPA data, but I have moved on to making a web app displaying current AQI from AirNow, and conditions from 1980 (the earliest collection in my study area, San Bernardino, CA) I have the EPA data for CO, SO2, NO2, and O3 symbolized by the AQI standards for harm/safety. In the web app however, I can only get 1980CO to show up in the attribute table widget. I would like for all 4 attribute table to be displayed, but can't figure out what's wrong. I would love some suggestions on how I can get the attribute tables to display.


Thanks,
Faith
- Mark as New
- Bookmark
- Subscribe
- Mute
- Subscribe to RSS Feed
- Permalink
Faith,
Are the other layers the same type as the 1980CO?
- Mark as New
- Bookmark
- Subscribe
- Mute
- Subscribe to RSS Feed
- Permalink
Hi Robert,
Yes they are all feature layers, from the same data source.

they are all functionally exactly the same...
- Mark as New
- Bookmark
- Subscribe
- Mute
- Subscribe to RSS Feed
- Permalink
Faith,
Not sure if this is even in the right direction, but are they all shared the same? permissions?
-Stan
- Mark as New
- Bookmark
- Subscribe
- Mute
- Subscribe to RSS Feed
- Permalink
Hi Stan, yes they all even have the same sharing level, within my organization. I even changed the levels too see if it would refresh or something. No luck. Thank you though. I would love to fix this, so if you think of anything else, let me know.
Faith
- Mark as New
- Bookmark
- Subscribe
- Mute
- Subscribe to RSS Feed
- Permalink
Did you ever get this figured out?
- Mark as New
- Bookmark
- Subscribe
- Mute
- Subscribe to RSS Feed
- Permalink
Faith,
Sorry I can not figure out why those other layer do not appear in the Attribute Table setting list. I would give tech support a call and see if this is a bug.